Wantagh: Fire Incidents, New York (NY)
Where are fire incidents reported in Wantagh, NY
Something went wrong! Please refresh the page.
|
| |||||||||||||||||||||||||||||||||||||||||||||||||||||||||||||||||||||||||||||||||||||||||||||||||||||||||||||
2003 - 2018 National Fire Incident Reporting System (NFIRS) incidents
- Incident types reported to NFIRS in Wantagh, NY
- 4,79259.9%Rescue & EMS
- 1,22115.3%False Alarm
- 7629.5%Service Call
- 7018.8%Hazardous Condition
- 3824.8%Good Intent Call
- 1191.5%Fire
- 130.2%Overpressure Rupture
- Fire incident types reported to NFIRS in Wantagh, NY
- 7764.7%Structure Fires
- 3731.1%Outside Fires
- 43.4%Other
- 10.8%Mobile Property/Vehicle Fires
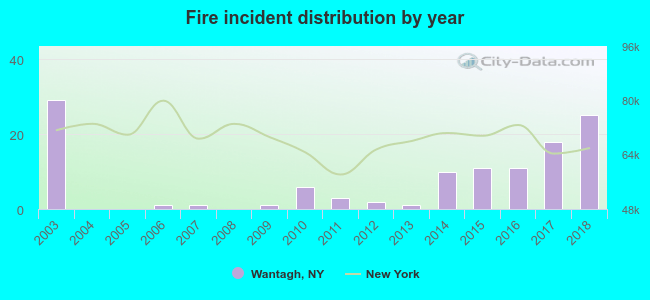 Based on the data from the years 2003 - 2018 the average number of fire incidents per year is 7. The highest number of fire incidents - 29 took place in 2003, and the least - 0 in 2004. The data has a declining trend.
The average number of yearly fire incidents per 10k residents in Wantagh, NY compared to nearest cities:
(Note: Based on data for the last 3 years, including only cities with population 5,000 and above)
| Wantagh: | 9.5 |
| Seaford: | 3.3 |
| Bellmore: | 6.0 |
| North Bellmore: | 5.8 |
| Massapequa: | 22.9 |
| Merrick: | 13.0 |
| North Merrick: | 6.9 |
| North Massapequa: | 2.1 |
| Massapequa Park: | 17.4 |
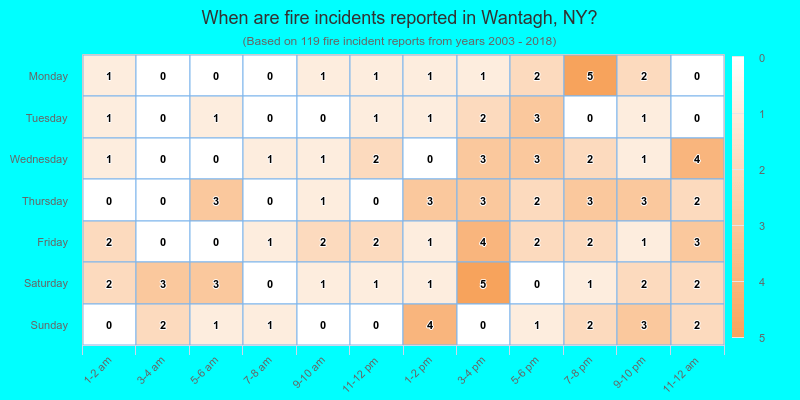
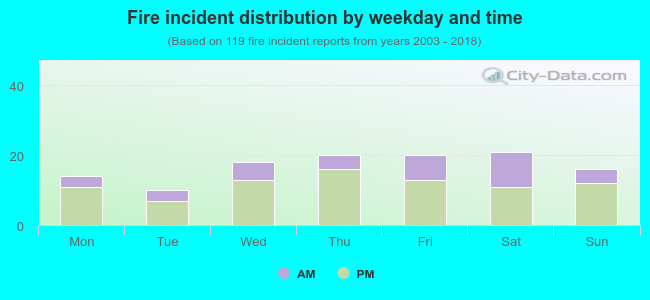 30.3% incidents where reported in the morning and 69.7% in the evening. The most fires (17.6%) took place on Saturday, and the least (8.4%) on Tuesday.
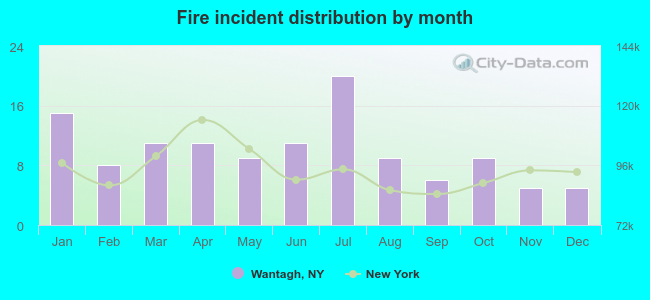 According to the 119 fire incident reports from years 2003 - 2018 most fires (16.8%) took place during July, and the least (4.2%) in November.
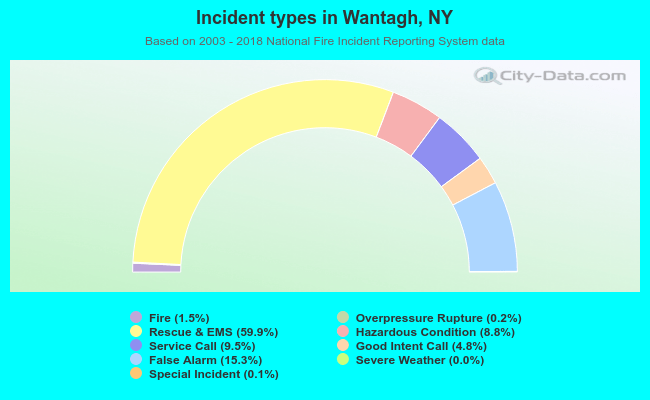 Out of all 7,996 cases reported during the years 2003 - 2018, the most belonged to the categories: Rescue & EMS (59.9%), False Alarm (15.3%), and Service Call (9.5%).
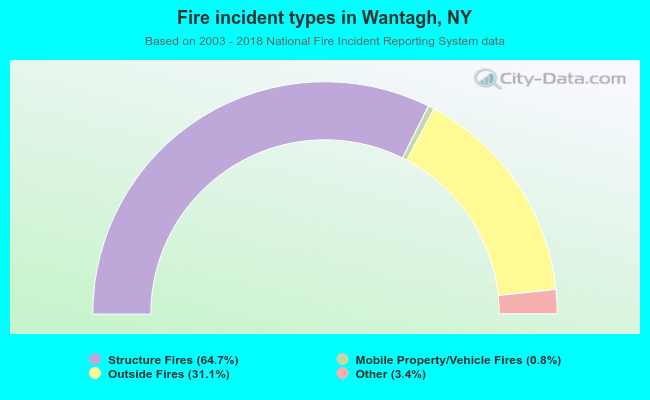 When looking into fire subcategories, the most incidents belonged to: Structure Fires (64.7%), and Outside Fires (31.1%).