Vancouver: Fire Incidents, Washington (WA)
Where are fire incidents reported in Vancouver, WA
Something went wrong! Please refresh the page.
| Fire incidents reported | |
|---|---|
| Sreet name | Count |
| MILL PLAIN BL | 574 |
| FOURTH PLAIN BL | 534 |
| HIGHWAY 99 HWY | 368 |
| HIGHWAY 99 | 348 |
| 18TH ST | 314 |
| HAZEL DELL AVE | 280 |
| NOT IN DATABASE | 194 |
| 72ND AV | 188 |
| 78TH ST | 184 |
| MAIN ST | 184 |
| 28TH ST | 182 |
| 117TH AV | 168 |
| 13TH ST | 166 |
| 7TH ST | 166 |
| 99TH ST | 164 |
| 39TH ST | 162 |
| SAINT JOHNS RD | 156 |
| 164TH AV | 152 |
| 49TH ST | 152 |
| ANDRESEN RD | 150 |
| LOWER RIVER RD | 138 |
| 112TH AV | 130 |
| FOURTH PLAIN BLVD | 130 |
| 54TH ST | 124 |
| 58TH ST | 124 |
| 99 ST | 124 |
| EVERGREEN BL | 122 |
| VANCOUVER MALL DR | 122 |
| 76TH ST | 116 |
| 8TH ST | 116 |
| Other | 7,534 |
2002 - 2018 National Fire Incident Reporting System (NFIRS) incidents
- Incident types reported to NFIRS in Vancouver, WA
- 73,33355.7%Rescue & EMS
- 27,25920.7%Good Intent Call
- 13,56610.3%Fire
- 7,2035.5%Service Call
- 5,1133.9%False Alarm
- 4,5313.4%Hazardous Condition
- 5150.4%Special Incident
- 1490.1%Overpressure Rupture
- Fire incident types reported to NFIRS in Vancouver, WA
- 6,94551.2%Outside Fires
- 3,87128.5%Structure Fires
- 1,95514.4%Mobile Property/Vehicle Fires
- 7955.9%Other
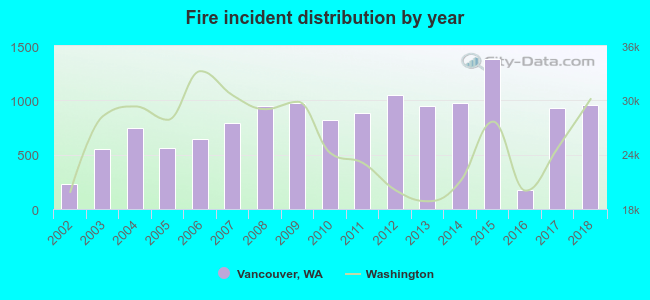 Based on the data from the years 2002 - 2018 the average number of fires per year is 798. The highest number of fire incidents - 1,381 took place in 2015, and the least - 174 in 2016. The data has an increasing trend.
The average number of yearly fire incidents per 10k residents in Vancouver, WA compared to nearest cities:
(Note: Based on data for the last 3 years, including only cities with population 5,000 and above)
| Vancouver: | 40.5 |
| Hazel Dell: | 4.1 |
| Camas: | 32.8 |
| Battle Ground: | 61.6 |
| Washougal: | 45.1 |
| Ridgefield: | 110.5 |
| Woodland: | 66.0 |
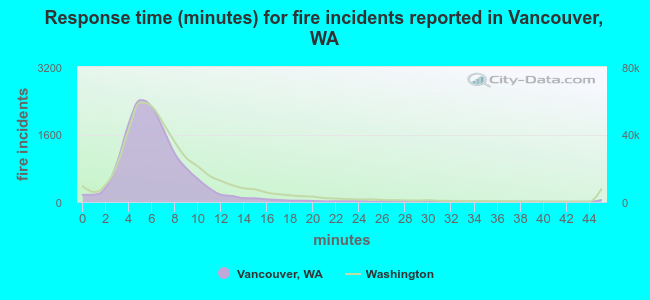 The median response time based on all reported fire incidents is 6 minutes. This is comparable to the Washington median value.
The median response time in Vancouver, WA compared to nearest cities:
(Note: Based on data for all years, including only cities with at least 500 fire incidents)
| Vancouver: | 6 minutes |
| Brush Prairie: | 7 minutes |
| Portland: | 5 minutes |
| Camas: | 7 minutes |
| Battle Ground: | 6 minutes |
| Gresham: | 5 minutes |
| Troutdale: | 5 minutes |
| Washougal: | 7 minutes |
| Milwaukie: | 5 minutes |
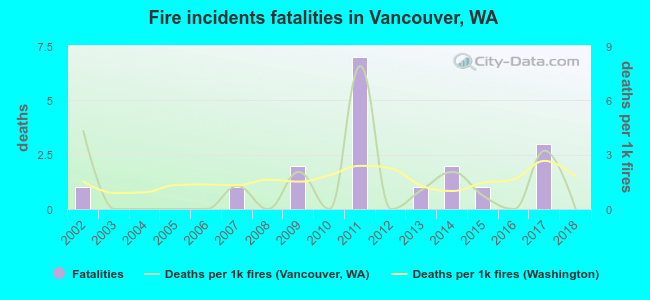 Based on the data from the years 2002 - 2018 the average number of fire-related yearly deaths is 1. The highest number of reported deaths - 7 took place in 2011, and the lowest - 0 in 2003. The data has a declining trend.
The average number of deaths per 1,000 fire incidents is 1. This indicator was the highest - 8 in 2011, and the lowest 0 in 2003. The trend for deaths per 1,000 fire incidents is declining. Compared to the Washington value the number of deaths per 1,000 fire incidents is similar.
Based on the data from the years 2002 - 2018 the average number of fire-related yearly deaths is 1. The highest number of reported deaths - 7 took place in 2011, and the lowest - 0 in 2003. The data has a declining trend.
The average number of deaths per 1,000 fire incidents is 1. This indicator was the highest - 8 in 2011, and the lowest 0 in 2003. The trend for deaths per 1,000 fire incidents is declining. Compared to the Washington value the number of deaths per 1,000 fire incidents is similar.
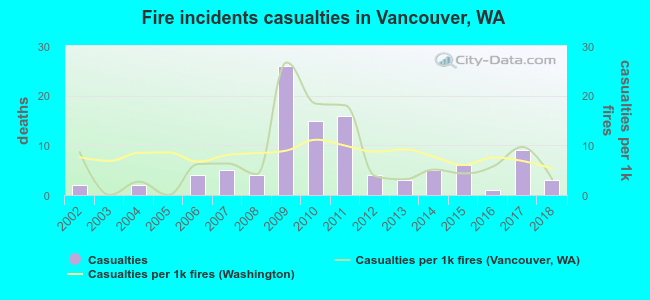 Based on the data from the years 2002 - 2018 the average number of fire-related casualties per year is 6. The highest number of casualties - 26 took place in 2009, and the lowest - 0 in 2003. The data has a rising trend.
The average number of casualties per 1,000 fire incidents is 7. This indicator was the highest - 27 in 2009, and the lowest 0 in 2003. The trend for casualties per 1,000 fire incidents is declining. Compared to the Washington value the number of casualties per 1,000 fires is about the same.
Based on the data from the years 2002 - 2018 the average number of fire-related casualties per year is 6. The highest number of casualties - 26 took place in 2009, and the lowest - 0 in 2003. The data has a rising trend.
The average number of casualties per 1,000 fire incidents is 7. This indicator was the highest - 27 in 2009, and the lowest 0 in 2003. The trend for casualties per 1,000 fire incidents is declining. Compared to the Washington value the number of casualties per 1,000 fires is about the same.Casualties per 1,000 incidents in Vancouver, WA compared to nearest cities:
(Note: Based on data for all years, including only cities with at least 500 fire incidents)
| Vancouver: | 7.7 |
| Brush Prairie: | 9.5 |
| Portland: | 15.9 |
| Camas: | 0.8 |
| Battle Ground: | 2.0 |
| Gresham: | 11.5 |
| Troutdale: | 18.6 |
| Washougal: | 0.8 |
| Milwaukie: | 24.0 |
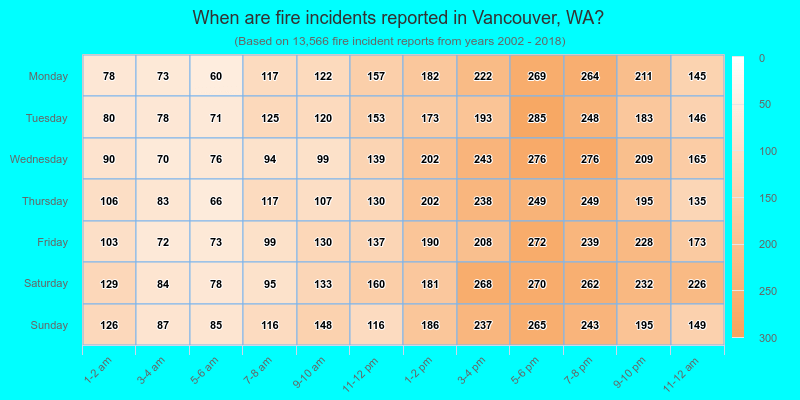
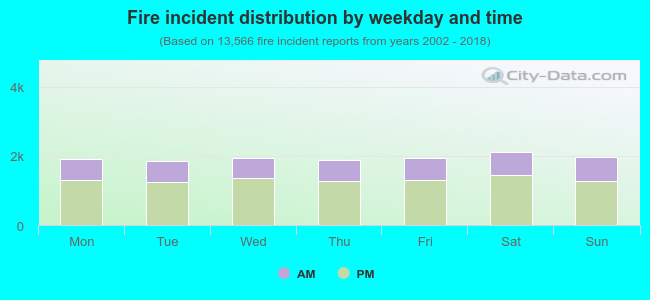 32.3% incidents where reported in the morning and 67.7% in the evening. The most fires (15.6%) took place on Saturday, and the least (13.7%) on Tuesday.
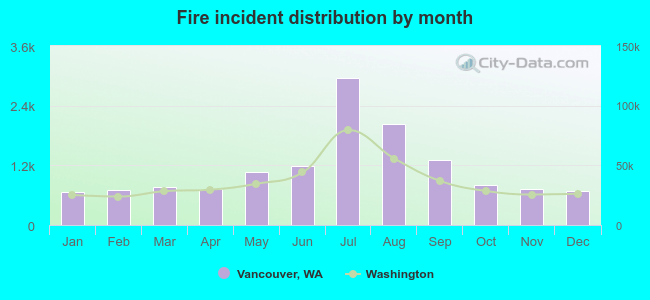 According to the 13,566 incident reports from years 2002 - 2018 most fires (21.7%) took place during July, and the least (4.8%) in January.
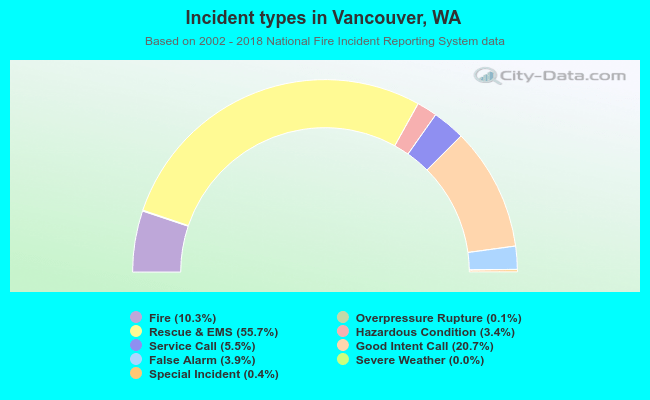 Out of all 131,690 cases reported during the years 2002 - 2018, the most belonged to the categories: Rescue & EMS (55.7%), Good Intent Call (20.7%), and Fire (10.3%).
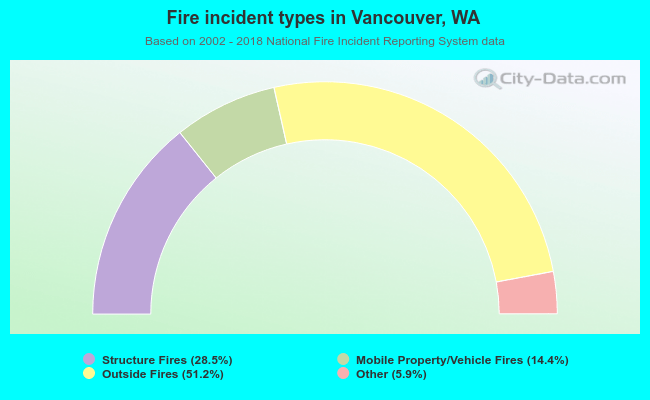 When looking into fire subcategories, the most incidents belonged to: Outside Fires (51.2%), and Structure Fires (28.5%).