Van Wert: Fire Incidents, Ohio (OH)
Where are fire incidents reported in Van Wert, OH
Something went wrong! Please refresh the page.
| Fire incidents reported | |
|---|---|
| Sreet name | Count |
| MAIN ST | 134 |
| WASHINGTON ST | 80 |
| SHANNON ST | 76 |
| FRANKLIN ST | 62 |
| US 127 | 50 |
| WALNUT ST | 50 |
| CHESTNUT ST | 38 |
| LINCOLN HWY | 38 |
| BURT ST | 34 |
| VINE ST | 34 |
| JEFFERSON ST | 32 |
| THISTLEWOOD CT | 28 |
| TYLER ST | 28 |
| MARKET ST | 26 |
| RACE ST | 26 |
| CHERRY ST | 24 |
| ERVIN RD | 22 |
| FOX RD | 22 |
| JOHN BROWN RD | 22 |
| MAPLE ST | 22 |
| TOWNE CENTER BLVD | 22 |
| VAN WERT DECATUR RD | 22 |
| WOODLAND AVE | 22 |
| CRAWFORD ST | 20 |
| PARK ST | 20 |
| SHAFFER ST | 18 |
| CENTER ST | 16 |
| KEAR RD | 16 |
| RICHEY RD | 16 |
| SYCAMORE ST | 16 |
| Other | 44 |
2002 - 2018 National Fire Incident Reporting System (NFIRS) incidents
- Incident types reported to NFIRS in Van Wert, OH
- 2,17043.8%Rescue & EMS
- 1,08021.8%Fire
- 80716.3%Hazardous Condition
- 3116.3%False Alarm
- 3106.3%Service Call
- 2344.7%Good Intent Call
- 160.3%Overpressure Rupture
- 150.3%Special Incident
- 80.2%Severe Weather
- Fire incident types reported to NFIRS in Van Wert, OH
- 54550.5%Structure Fires
- 36533.8%Outside Fires
- 16615.4%Mobile Property/Vehicle Fires
- 40.4%Other
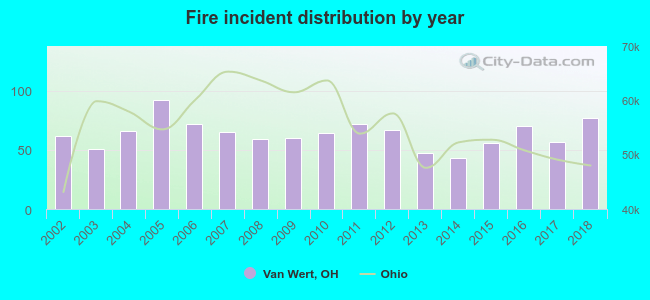 Based on the data from the years 2002 - 2018 the average number of fires per year is 64. The highest number of reported fires - 92 took place in 2005, and the least - 43 in 2014. The data has an increasing trend.
The average number of yearly fire incidents per 10k residents in Van Wert, OH compared to nearest cities:
(Note: Based on data for the last 3 years, including only cities with population 5,000 and above)
| Van Wert: | 63.2 |
| Delphos: | 75.3 |
| Celina: | 86.4 |
| Lima: | 90.6 |
| Wapakoneta: | 66.9 |
| Defiance: | 132.7 |
 The median response time based on all reported fire incidents is 7 minutes. This is about the same as the Ohio median value.
The median response time in Van Wert, OH compared to nearest cities:
(Note: Based on data for all years, including only cities with at least 500 fire incidents)
| Van Wert: | 7 minutes |
| Delphos: | 5 minutes |
| Decatur: | 5 minutes |
| Paulding: | 12 minutes |
| Elida: | 6 minutes |
| Celina: | 8 minutes |
| Lima: | 4 minutes |
| New Haven: | 5 minutes |
| Wapakoneta: | 8 minutes |
 According to the data from the years 2002 - 2018 the average number of fire-related yearly deaths is 0. The highest number of deaths - 2 took place in 2018, and the lowest - 0 in 2002. The data has an increasing trend.
 According to the data from the years 2002 - 2018 the average number of fire-related casualties per year is 1. The highest number of casualties - 6 took place in 2007, and the lowest - 0 in 2004. The data has a decreasing trend.
The average number of injuries per 1,000 fires is 22. This indicator was the highest - 92 in 2007, and the lowest 0 in 2004. The trend for injuries per 1,000 fires is decreasing. Compared to the state value the number of casualties per 1,000 incidents is higher.
According to the data from the years 2002 - 2018 the average number of fire-related casualties per year is 1. The highest number of casualties - 6 took place in 2007, and the lowest - 0 in 2004. The data has a decreasing trend.
The average number of injuries per 1,000 fires is 22. This indicator was the highest - 92 in 2007, and the lowest 0 in 2004. The trend for injuries per 1,000 fires is decreasing. Compared to the state value the number of casualties per 1,000 incidents is higher.
 28.2% incidents where reported in the morning and 71.8% in the evening. The most fires (16.1%) took place on Sunday, and the least (11.6%) on Tuesday.
 Based on the 1,080 fire incident reports from years 2002 - 2018 most fires (12.1%) took place during April, and the least (6.3%) in January.
 Out of all 4,951 cases reported during the years 2002 - 2018, the most belonged to the categories: Rescue & EMS (43.8%), Fire (21.8%), and Hazardous Condition (16.3%).
 When looking into fire subcategories, the most reports belonged to: Structure Fires (50.5%), and Outside Fires (33.8%).