Trussville: Fire Incidents, Alabama (AL)
Where are fire incidents reported in Trussville, AL
Something went wrong! Please refresh the page.
|
| |||||||||||||||||||||||||||||||||||||||||||||||||||||||||||||||||||||||||||||||||||||||||||||||||||||||||||||
2005 - 2018 National Fire Incident Reporting System (NFIRS) incidents
- Incident types reported to NFIRS in Trussville, AL
- 3,24958.5%Rescue & EMS
- 76213.7%Fire
- 64811.7%Service Call
- 3245.8%False Alarm
- 2484.5%Good Intent Call
- 2394.3%Hazardous Condition
- 671.2%Severe Weather
- 130.2%Special Incident
- 60.1%Overpressure Rupture
- Fire incident types reported to NFIRS in Trussville, AL
- 44358.1%Outside Fires
- 14318.8%Structure Fires
- 14118.5%Mobile Property/Vehicle Fires
- 354.6%Other
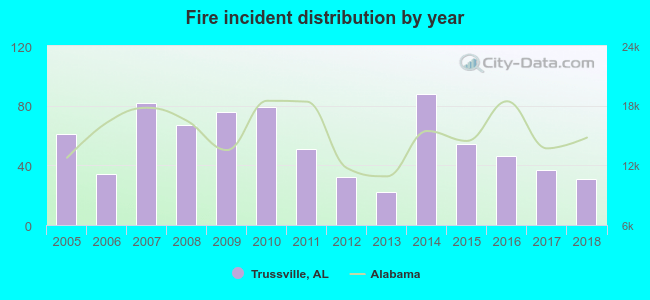 Based on the data from the years 2005 - 2018 the average number of fire incidents per year is 54. The highest number of reported fire incidents - 88 took place in 2014, and the least - 22 in 2013. The data has a decreasing trend.
The average number of yearly fire incidents per 10k residents in Trussville, AL compared to nearest cities:
(Note: Based on data for the last 3 years, including only cities with population 5,000 and above)
| Trussville: | 18.4 |
| Center Point: | 49.5 |
| Clay: | 5.2 |
| Leeds: | 53.0 |
| Moody: | 36.9 |
| Pinson: | 104.1 |
| Irondale: | 55.7 |
| Tarrant: | 58.6 |
| Fultondale: | 48.3 |
 The median response time based on all reported fire incidents is 7 minutes. This is similar to the state median value.
The median response time in Trussville, AL compared to nearest cities:
(Note: Based on data for all years, including only cities with at least 500 fire incidents)
| Trussville: | 7 minutes |
| Leeds: | 5 minutes |
| Pinson: | 6 minutes |
| Irondale: | 5 minutes |
| Tarrant: | 3 minutes |
| Birmingham: | 6 minutes |
| Homewood: | 6 minutes |
| Vestavia Hills: | 4 minutes |
| Hoover: | 5 minutes |
 24.7% incidents where reported in the morning and 75.3% in the evening. The most fires (16.3%) took place on Friday, and the least (11.9%) on Thursday.
 According to the 762 fire incident reports from years 2005 - 2018 most fires (14.8%) took place during March, and the least (5.5%) in December.
 Out of all 5,556 cases reported during the years 2005 - 2018, the most belonged to the categories: Rescue & EMS (58.5%), Fire (13.7%), and Service Call (11.7%).
 When looking into fire subcategories, the most incidents belonged to: Outside Fires (58.1%), and Structure Fires (18.8%).