Thomaston: Fire Incidents, Georgia (GA)
Where are fire incidents reported in Thomaston, GA
Something went wrong! Please refresh the page.
|
| |||||||||||||||||||||||||||||||||||||||||||||||||||||||||||||||||||||||||||||||||||||||||||||||||||||||||||||
| Other | 120 | |||||||||||||||||||||||||||||||||||||||||||||||||||||||||||||||||||||||||||||||||||||||||||||||||||||||||||||
2002 - 2018 National Fire Incident Reporting System (NFIRS) incidents
- Incident types reported to NFIRS in Thomaston, GA
- 3,62365.4%Rescue & EMS
- 62211.2%Fire
- 3416.2%Service Call
- 3025.5%Hazardous Condition
- 2925.3%False Alarm
- 2634.7%Good Intent Call
- 591.1%Special Incident
- 240.4%Severe Weather
- 130.2%Overpressure Rupture
- Fire incident types reported to NFIRS in Thomaston, GA
- 27143.6%Outside Fires
- 25040.2%Structure Fires
- 8213.2%Mobile Property/Vehicle Fires
- 193.1%Other
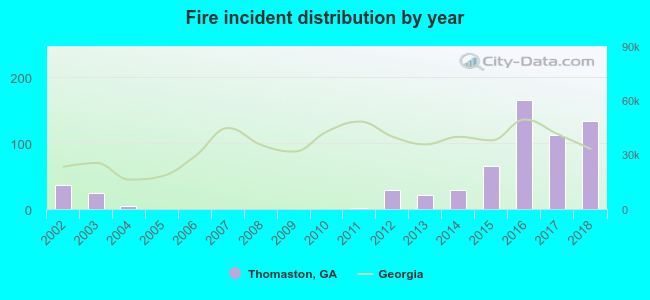 Based on the data from the years 2002 - 2018 the average number of fires per year is 37. The highest number of fires - 165 took place in 2016, and the least - 0 in 2005. The data has an increasing trend.
The average number of yearly fire incidents per 10k residents in Thomaston, GA compared to nearest cities:
(Note: Based on data for the last 3 years, including only cities with population 5,000 and above)
| Thomaston: | 152.7 |
| Barnesville: | 151.9 |
| Griffin: | 128.7 |
| Lizella: | 21.5 |
| Locust Grove: | 116.9 |
| Hampton: | 159.3 |
| Fort Valley: | 39.1 |
| Peachtree City: | 15.6 |
| Fayetteville: | 114.4 |
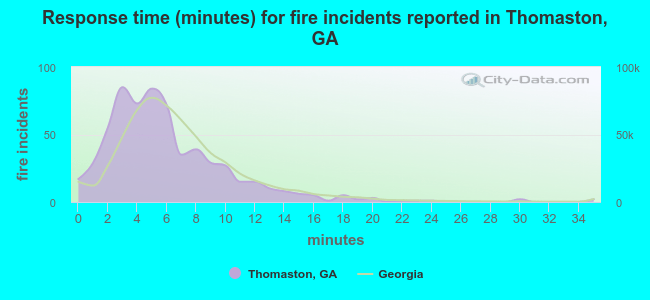 The median response time based on all reported fire incidents is 5 minutes. This is lower compared to the state median value.
The median response time in Thomaston, GA compared to nearest cities:
(Note: Based on data for all years, including only cities with at least 500 fire incidents)
| Thomaston: | 5 minutes |
| Barnesville: | 6 minutes |
| Roberta: | 12 minutes |
| Butler: | 10 minutes |
| Forsyth: | 6 minutes |
| Griffin: | 5 minutes |
| Pine Mountain: | 8 minutes |
| Senoia: | 7 minutes |
| Locust Grove: | 8 minutes |
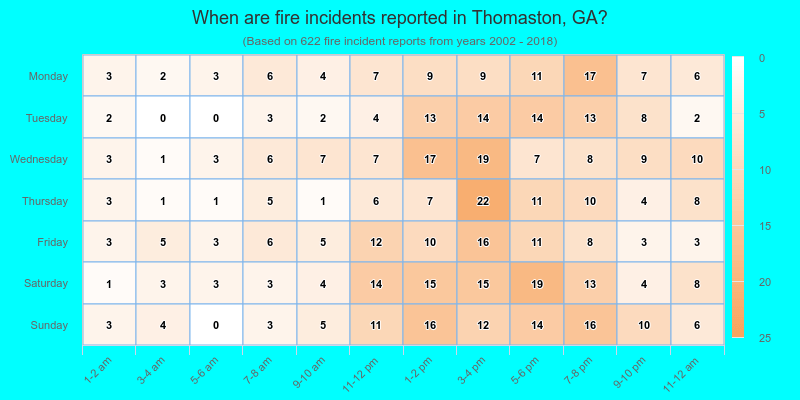
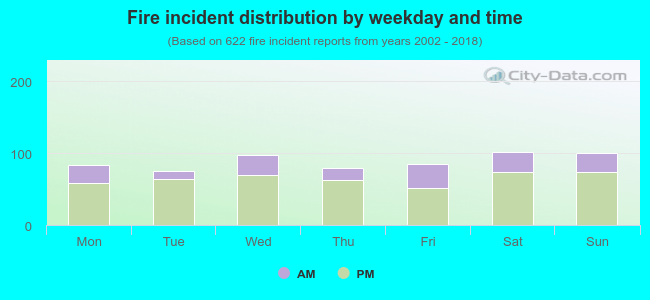 27.0% incidents where reported in the morning and 73.0% in the evening. The most fires (16.4%) took place on Saturday, and the least (12.1%) on Tuesday.
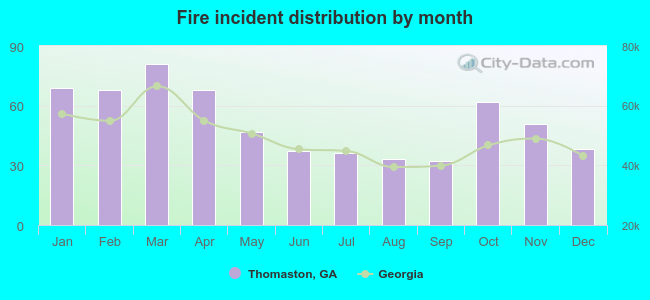 Based on the 622 incident reports from years 2002 - 2018 most fires (13.0%) took place during March, and the least (5.1%) in September.
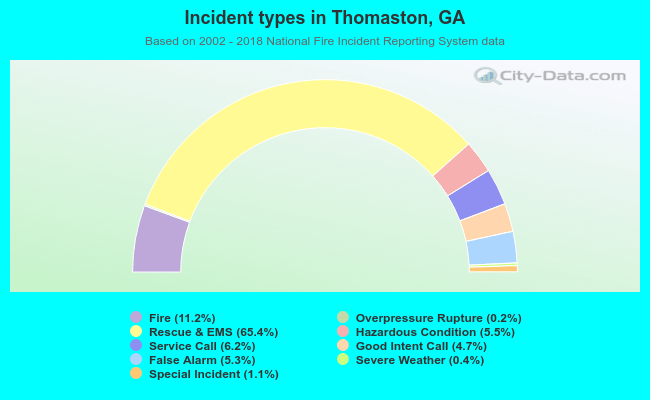 Out of all 5,539 cases reported during the years 2002 - 2018, the most belonged to the categories: Rescue & EMS (65.4%), Fire (11.2%), and Service Call (6.2%).
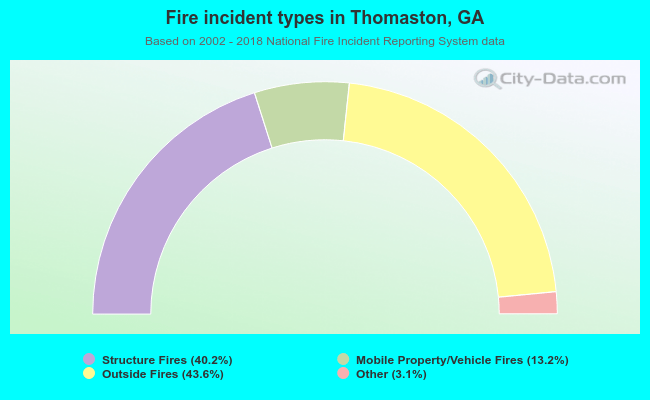 When looking into fire subcategories, the most incidents belonged to: Outside Fires (43.6%), and Structure Fires (40.2%).