Terre Haute: Fire Incidents, Indiana (IN)
Where are fire incidents reported in Terre Haute, IN
Something went wrong! Please refresh the page.
| Fire incidents reported | |
|---|---|
| Sreet name | Count |
| US 41 HWY | 136 |
| PARK AVE | 122 |
| CLINTON ST | 92 |
| 7TH ST | 88 |
| WABASH AVE | 84 |
| FRUITRIDGE AVE | 72 |
| LAFAYETTE AVE | 62 |
| ROSEDALE RD | 62 |
| 25TH ST | 60 |
| 13 TH ST | 58 |
| 13TH ST | 58 |
| HAYTHORNE AVE | 58 |
| SPRINGHILL DR | 56 |
| 3RD AVE | 52 |
| 3RD ST | 52 |
| HARLAN DR | 50 |
| 12TH ST | 48 |
| ERICKSON ST | 48 |
| MCDANIEL RD | 48 |
| INTERSTATE 70 | 46 |
| ROSEHILL AVE | 46 |
| 2ND AVE | 44 |
| RIO GRANDE AVE | 44 |
| ST RD 46 | 42 |
| 9TH ST | 40 |
| ESTATE RD | 40 |
| FRENCH DR | 40 |
| MARGARET DR | 40 |
| 16TH ST | 38 |
| 4TH ST | 38 |
| Other | 1,963 |
2002 - 2018 National Fire Incident Reporting System (NFIRS) incidents
- Incident types reported to NFIRS in Terre Haute, IN
- 23,03466.5%Rescue & EMS
- 3,72710.8%Fire
- 3,46010.0%Good Intent Call
- 2,0485.9%Hazardous Condition
- 1,2213.5%False Alarm
- 1,0793.1%Service Call
- Fire incident types reported to NFIRS in Terre Haute, IN
- 1,60143.0%Structure Fires
- 1,24133.3%Outside Fires
- 65017.4%Mobile Property/Vehicle Fires
- 2356.3%Other
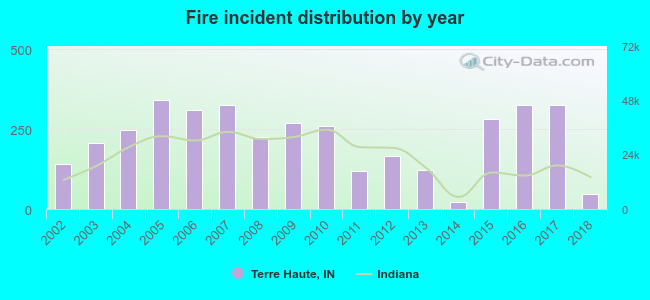 According to the data from the years 2002 - 2018 the average number of fires per year is 219. The highest number of fires - 340 took place in 2005, and the least - 23 in 2014. The data has a dropping trend.
The average number of yearly fire incidents per 10k residents in Terre Haute, IN compared to nearest cities:
(Note: Based on data for the last 3 years, including only cities with population 5,000 and above)
| Terre Haute: | 38.1 |
| Brazil: | 33.3 |
| Greencastle: | 44.4 |
| Linton: | 11.3 |
 The median response time based on all reported fire incidents is 6 minutes. This is close to the Indiana median value.
The median response time in Terre Haute, IN compared to nearest cities:
(Note: Based on data for all years, including only cities with at least 500 fire incidents)
| Terre Haute: | 6 minutes |
| West Terre Haute: | 5 minutes |
| Clinton: | 5 minutes |
| Brazil: | 6 minutes |
| Marshall: | 9 minutes |
| Paris: | 6 minutes |
| Rockville: | 8 minutes |
| Sullivan: | 4 minutes |
| Greencastle: | 9 minutes |
 Based on the data from the years 2002 - 2018 the average number of fire-related yearly deaths is 0. The highest number of deaths - 1 took place in 2004, and the lowest - 0 in 2002. The data has an increasing trend.
The average number of fatalities per 1,000 fires is 2. This indicator was the highest - 22 in 2018, and the lowest 0 in 2002. The trend for deaths per 1,000 fires is rising. Compared to the state value the number of fatalities per 1,000 fire incidents is similar.
Based on the data from the years 2002 - 2018 the average number of fire-related yearly deaths is 0. The highest number of deaths - 1 took place in 2004, and the lowest - 0 in 2002. The data has an increasing trend.
The average number of fatalities per 1,000 fires is 2. This indicator was the highest - 22 in 2018, and the lowest 0 in 2002. The trend for deaths per 1,000 fires is rising. Compared to the state value the number of fatalities per 1,000 fire incidents is similar.Deaths per 1,000 incidents in Terre Haute, IN compared to nearest cities:
(Note: Based on data for all years, including only cities with at least 2,500 fire incidents)
| Terre Haute: | 1.3 |
 Based on the reports from the years 2002 - 2018 the average number of fire-related yearly casualties is 3. The highest number of casualties - 6 took place in 2004, and the lowest - 0 in 2011. The data has a declining trend.
The average number of casualties per 1,000 fire incidents is 14. This indicator was the highest - 28 in 2002, and the lowest 0 in 2011. The trend for injuries per 1,000 fire incidents is dropping. Compared to the Indiana value the number of casualties per 1,000 fires is much higher.
Based on the reports from the years 2002 - 2018 the average number of fire-related yearly casualties is 3. The highest number of casualties - 6 took place in 2004, and the lowest - 0 in 2011. The data has a declining trend.
The average number of casualties per 1,000 fire incidents is 14. This indicator was the highest - 28 in 2002, and the lowest 0 in 2011. The trend for injuries per 1,000 fire incidents is dropping. Compared to the Indiana value the number of casualties per 1,000 fires is much higher.Casualties per 1,000 incidents in Terre Haute, IN compared to nearest cities:
(Note: Based on data for all years, including only cities with at least 500 fire incidents)
| Terre Haute: | 15.3 |
| West Terre Haute: | 4.0 |
| Clinton: | 4.9 |
| Brazil: | 9.3 |
| Marshall: | 5.1 |
| Paris: | 20.6 |
| Rockville: | 1.4 |
| Sullivan: | 0.0 |
| Greencastle: | 5.2 |
 34.1% incidents where reported in the morning and 65.9% in the evening. The most fires (16.0%) took place on Sunday, and the least (13.1%) on Wednesday.
 According to the 3,727 fire incidents from years 2002 - 2018 most fires (11.2%) took place during March, and the least (6.3%) in September.
 Out of all 34,646 cases reported during the years 2002 - 2018, the most belonged to the categories: Rescue & EMS (66.5%), Fire (10.8%), and Good Intent Call (10.0%).
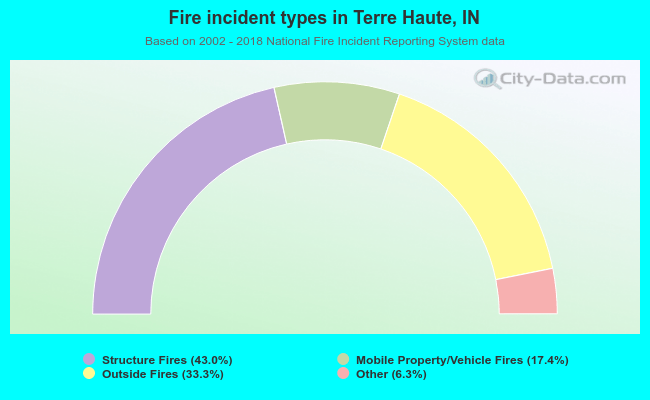 When looking into fire subcategories, the most incidents belonged to: Structure Fires (43.0%), and Outside Fires (33.3%).