Stratford: Fire Incidents, New Jersey (NJ)
Where are fire incidents reported in Stratford, NJ
Something went wrong! Please refresh the page.
|
| |||||||||||||||||||||||||||||||||||||||||||||||||||||||||||||||||||||||||||||||||||||||||||||||||||||||||||||
2002 - 2018 National Fire Incident Reporting System (NFIRS) incidents
- Incident types reported to NFIRS in Stratford, NJ
- 84734.3%Hazardous Condition
- 49920.2%Fire
- 35814.5%False Alarm
- 31712.8%Good Intent Call
- 25110.2%Rescue & EMS
- 1536.2%Service Call
- 371.5%Overpressure Rupture
- 50.2%Severe Weather
- 30.1%Special Incident
- Fire incident types reported to NFIRS in Stratford, NJ
- 36172.3%Structure Fires
- 7715.4%Outside Fires
- 326.4%Mobile Property/Vehicle Fires
- 295.8%Other
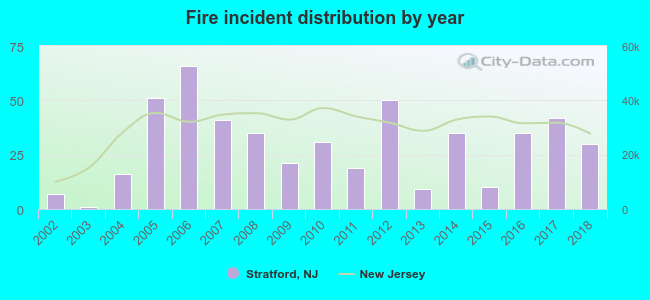 Based on the data from the years 2002 - 2018 the average number of fire incidents per year is 29. The highest number of fires - 66 took place in 2006, and the least - 1 in 2003. The data has a rising trend.
The average number of yearly fire incidents per 10k residents in Stratford, NJ compared to nearest cities:
(Note: Based on data for the last 3 years, including only cities with population 5,000 and above)
| Stratford: | 51.4 |
| Somerdale: | 85.5 |
| Lindenwold: | 36.9 |
| Pine Hill: | 69.8 |
| Barrington: | 61.0 |
| Runnemede: | 46.2 |
| Haddon Heights: | 29.4 |
| Haddonfield: | 26.9 |
| Berlin: | 33.1 |

 31.5% incidents where reported in the morning and 68.5% in the evening. The most fires (24.4%) took place on Monday, and the least (9.0%) on Sunday.
 Based on the 499 incident reports from years 2002 - 2018 most fires (12.0%) took place during March, and the least (5.2%) in September.
 Out of all 2,470 cases reported during the years 2002 - 2018, the most belonged to the categories: Hazardous Condition (34.3%), Fire (20.2%), and False Alarm (14.5%).
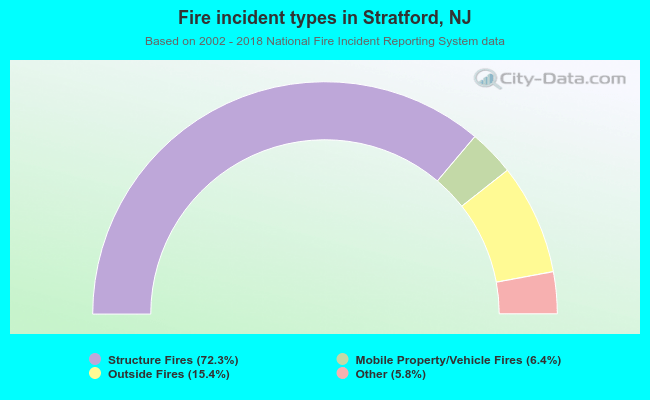 When looking into fire subcategories, the most reports belonged to: Structure Fires (72.3%), and Outside Fires (15.4%).