St. Joseph: Fire Incidents, Minnesota (MN)
Where are fire incidents reported in St. Joseph, MN
Something went wrong! Please refresh the page.
|
| |||||||||||||||||||||||||||||||||||||||||||||||||||||||||||||||||||||||||||||||||||||||||||||||||||||||||||||
2002 - 2011 National Fire Incident Reporting System (NFIRS) incidents
- Incident types reported to NFIRS in St. Joseph, MN
- 34939.4%Rescue & EMS
- 25128.3%Fire
- 22124.9%Hazardous Condition
- 445.0%Good Intent Call
- 111.2%False Alarm
- 50.6%Service Call
- 40.5%Severe Weather
- 10.1%Overpressure Rupture
- Fire incident types reported to NFIRS in St. Joseph, MN
- 9437.5%Outside Fires
- 8031.9%Structure Fires
- 6827.1%Mobile Property/Vehicle Fires
- 93.6%Other
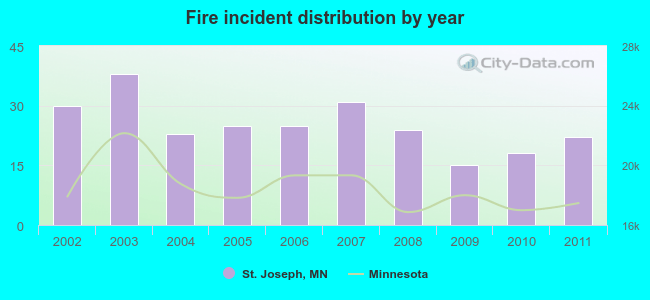 According to the data from the years 2002 - 2011 the average number of fire incidents per year is 25. The highest number of fire incidents - 38 took place in 2003, and the least - 15 in 2009. The data has a dropping trend.
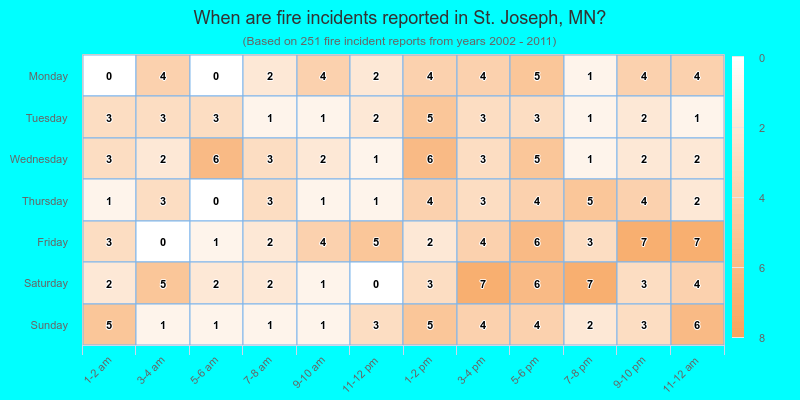
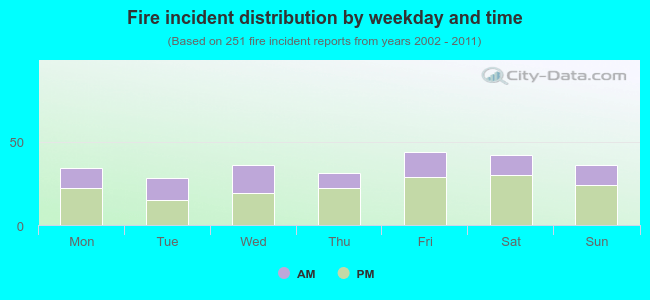 35.9% incidents where reported in the morning and 64.1% in the evening. The most fires (17.5%) took place on Friday, and the least (11.2%) on Tuesday.
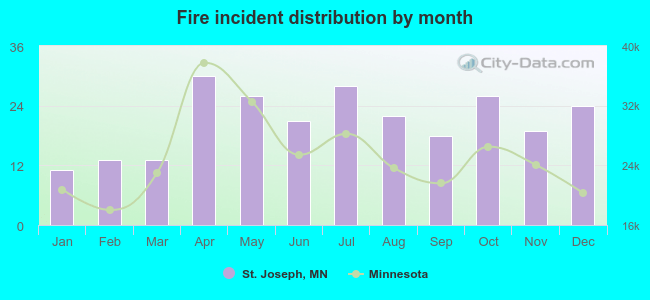 Based on the 251 fire incidents from years 2002 - 2011 most fires (12.0%) took place during April, and the least (4.4%) in January.
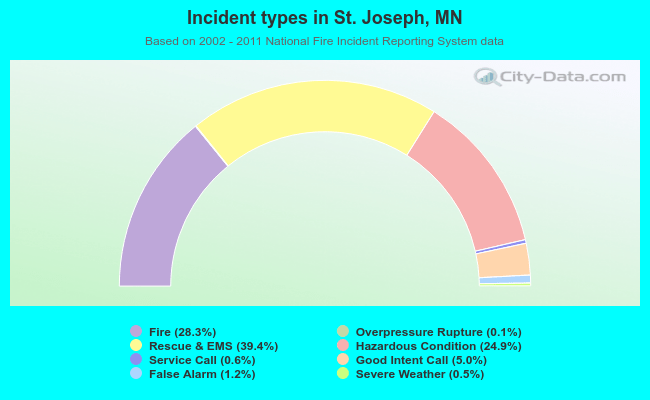 Out of all 886 cases reported during the years 2002 - 2011, the most belonged to the categories: Rescue & EMS (39.4%), Fire (28.3%), and Hazardous Condition (24.9%).
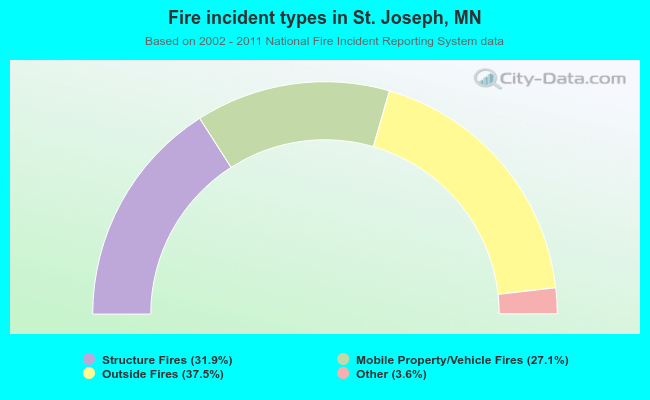 When looking into fire subcategories, the most incidents belonged to: Outside Fires (37.5%), and Structure Fires (31.9%).