South Plainfield: Fire Incidents, New Jersey (NJ)
Where are fire incidents reported in South Plainfield, NJ
Something went wrong! Please refresh the page.
| Fire incidents reported | |
|---|---|
| Sreet name | Count |
| STELTON ROAD | 178 |
| HAMILTON BOULEVARD | 146 |
| HADLEY ROAD | 114 |
| PARK AVENUE | 92 |
| DURHAM AVENUE | 90 |
| HADLEY CENTER DRIVE | 90 |
| OAK TREE ROAD | 74 |
| PLAINFIELD AVENUE | 72 |
| NEW MARKET AVENUE | 70 |
| HARMICH ROAD | 54 |
| OAK TREE AVENUE | 54 |
| CORPORATE BOULEVARD | 52 |
| MAPLE AVENUE | 52 |
| MORRIS AVENUE | 48 |
| ROUTE 287 NORTH | 48 |
| SOUTH CLINTON AVENUE | 48 |
| CORPORATE COURT | 42 |
| ROUTE 287 SOUTH | 42 |
| SOUTH PLAINFIELD AVENUE | 40 |
| CLINTON AVENUE | 32 |
| NEW WORLD WAY | 30 |
| FRONT STREET | 28 |
| MONTROSE AVENUE | 28 |
| NEW BRUNSWICK AVENUE | 28 |
| ROOSEVELT AVENUE | 26 |
| SAINT NICHOLAS AVENUE | 26 |
| NEW DURHAM ROAD | 24 |
| WEST SEVENTH STREET | 24 |
| CEDARBROOK AVENUE | 20 |
| SAMPTON AVENUE | 20 |
2002 - 2018 National Fire Incident Reporting System (NFIRS) incidents
- Incident types reported to NFIRS in South Plainfield, NJ
- 3,84048.4%Hazardous Condition
- 1,68521.2%False Alarm
- 1,60620.2%Fire
- 3123.9%Service Call
- 3093.9%Good Intent Call
- 1642.1%Rescue & EMS
- 100.1%Overpressure Rupture
- Fire incident types reported to NFIRS in South Plainfield, NJ
- 70043.6%Outside Fires
- 64039.9%Structure Fires
- 23014.3%Mobile Property/Vehicle Fires
- 362.2%Other
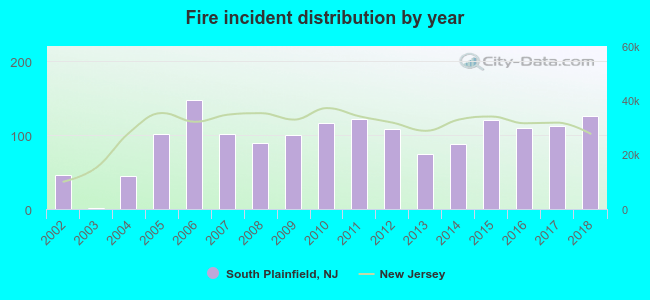 Based on the data from the years 2002 - 2018 the average number of fire incidents per year is 94. The highest number of reported fires - 147 took place in 2006, and the least - 1 in 2003. The data has a rising trend.
The average number of yearly fire incidents per 10k residents in South Plainfield, NJ compared to nearest cities:
(Note: Based on data for the last 3 years, including only cities with population 5,000 and above)
| South Plainfield: | 48.3 |
| Plainfield: | 25.8 |
| Dunellen: | 9.0 |
| North Plainfield: | 21.8 |
| Edison: | 3.6 |
| Metuchen: | 13.7 |
| Watchung: | 19.9 |
| Fanwood: | 9.6 |
| Scotch Plains: | 31.4 |
 The median response time based on all reported fire incidents is 4 minutes. This is lower than the state median value.
The median response time in South Plainfield, NJ compared to nearest cities:
(Note: Based on data for all years, including only cities with at least 500 fire incidents)
| South Plainfield: | 4 minutes |
| Plainfield: | 5 minutes |
| North Plainfield: | 5 minutes |
| Scotch Plains: | 6 minutes |
| Iselin: | 5 minutes |
| Colonia: | 5 minutes |
| Highland Park: | 2 minutes |
| Westfield: | 3 minutes |
| Clark: | 6 minutes |
 Based on the data from the years 2002 - 2018 the average number of fire-related casualties per year is 2. The highest number of injuries - 7 took place in 2016, and the lowest - 0 in 2003. The data has a dropping trend.
The average number of injuries per 1,000 fire incidents is 21. This indicator was the highest - 64 in 2016, and the lowest 0 in 2003. The trend for injuries per 1,000 fire incidents is decreasing. Compared to the New Jersey value the number of injuries per 1,000 fires is much higher.
Based on the data from the years 2002 - 2018 the average number of fire-related casualties per year is 2. The highest number of injuries - 7 took place in 2016, and the lowest - 0 in 2003. The data has a dropping trend.
The average number of injuries per 1,000 fire incidents is 21. This indicator was the highest - 64 in 2016, and the lowest 0 in 2003. The trend for injuries per 1,000 fire incidents is decreasing. Compared to the New Jersey value the number of injuries per 1,000 fires is much higher.Casualties per 1,000 incidents in South Plainfield, NJ compared to nearest cities:
(Note: Based on data for all years, including only cities with at least 500 fire incidents)
| South Plainfield: | 21.8 |
| Plainfield: | 16.7 |
| North Plainfield: | 31.9 |
| Scotch Plains: | 4.8 |
| Iselin: | 5.1 |
| Colonia: | 5.7 |
| Highland Park: | 7.3 |
| Westfield: | 9.8 |
| Clark: | 14.5 |
 28.8% incidents where reported in the morning and 71.2% in the evening. The most fires (15.8%) took place on Monday, and the least (12.5%) on Sunday.
 Based on the 1,606 fire incidents from years 2002 - 2018 most fires (12.6%) took place during May, and the least (6.5%) in February.
 Out of all 7,938 cases reported during the years 2002 - 2018, the most belonged to the categories: Hazardous Condition (48.4%), False Alarm (21.2%), and Fire (20.2%).
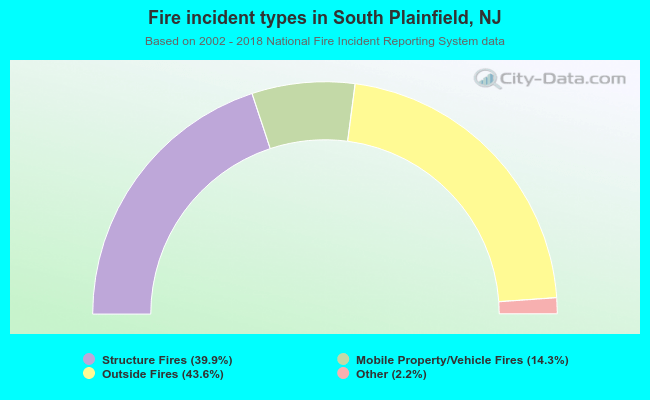 When looking into fire subcategories, the most incidents belonged to: Outside Fires (43.6%), and Structure Fires (39.9%).