South Euclid: Fire Incidents, Ohio (OH)
Where are fire incidents reported in South Euclid, OH
Something went wrong! Please refresh the page.
| Fire incidents reported | |
|---|---|
| Sreet name | Count |
| CEDAR RD | 174 |
| MAYFIELD RD | 160 |
| GREEN RD | 148 |
| WARRENSVILLE CENTER RD | 64 |
| GREENVALE DR | 52 |
| BELVOIR BLVD | 44 |
| PRINCETON BLVD | 40 |
| BAYARD RD | 32 |
| COLONY RD | 32 |
| MONTICELLO BLVD | 30 |
| STILMORE RD | 30 |
| VERONA RD | 30 |
| PLAINFIELD RD | 28 |
| ANTISDALE RD | 26 |
| CEDAR | 26 |
| COLLEGE RD | 26 |
| SALISBURY RD | 26 |
| STONEHAVEN RD | 26 |
| ARGONNE RD | 24 |
| BLUESTONE RD | 22 |
| COLONY | 22 |
| WILMINGTON RD | 22 |
| WRENFORD RD | 22 |
| ANDERSON RD | 20 |
| DORSH RD | 20 |
| OAKMOUNT RD | 20 |
| OKALONA RD | 20 |
| GLENRIDGE RD | 18 |
| GROSVENOR RD | 18 |
| WINSTON RD | 18 |
2002 - 2018 National Fire Incident Reporting System (NFIRS) incidents
- Incident types reported to NFIRS in South Euclid, OH
- 10,15156.6%Rescue & EMS
- 2,82815.8%Hazardous Condition
- 2,27612.7%False Alarm
- 1,1306.3%Fire
- 7894.4%Service Call
- 7284.1%Good Intent Call
- 230.1%Overpressure Rupture
- 190.1%Special Incident
- Fire incident types reported to NFIRS in South Euclid, OH
- 77268.3%Structure Fires
- 22820.2%Outside Fires
- 12210.8%Mobile Property/Vehicle Fires
- 80.7%Other
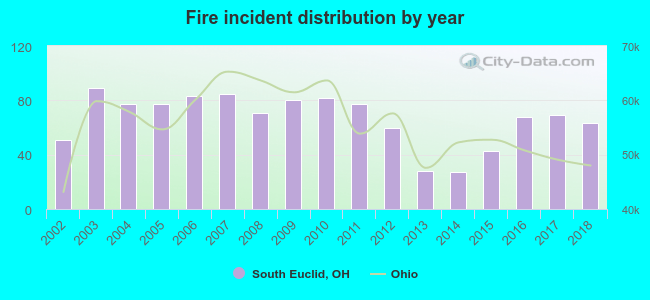 According to the data from the years 2002 - 2018 the average number of fires per year is 66. The highest number of fire incidents - 89 took place in 2003, and the least - 27 in 2014. The data has an increasing trend.
The average number of yearly fire incidents per 10k residents in South Euclid, OH compared to nearest cities:
(Note: Based on data for the last 3 years, including only cities with population 5,000 and above)
| South Euclid: | 30.5 |
| University Heights: | 50.2 |
| Lyndhurst: | 28.4 |
| Cleveland Heights: | 40.4 |
| Richmond Heights: | 52.1 |
| East Cleveland: | 85.7 |
| Beachwood: | 34.5 |
| Shaker Heights: | 34.3 |
| Highland Heights: | 34.7 |
 The median response time based on all reported fire incidents is 6 minutes. This is comparable to the Ohio median value.
The median response time in South Euclid, OH compared to nearest cities:
(Note: Based on data for all years, including only cities with at least 500 fire incidents)
| South Euclid: | 6 minutes |
| University Heights: | 5 minutes |
| Lyndhurst: | 5 minutes |
| Cleveland Heights: | 5 minutes |
| East Cleveland: | 3 minutes |
| Beachwood: | 4 minutes |
| Shaker Heights: | 4 minutes |
| Mayfield Heights: | 4 minutes |
| Euclid: | 5 minutes |
 Based on the data from the years 2002 - 2018 the average number of fire-related casualties per year is 2. The highest number of injuries - 6 took place in 2004, and the lowest - 0 in 2013. The data has a declining trend.
The average number of injuries per 1,000 fire incidents is 33. This indicator was the highest - 85 in 2008, and the lowest 0 in 2013. The trend for injuries per 1,000 fires is decreasing. Compared to the state value the number of casualties per 1,000 fire incidents is much higher.
Based on the data from the years 2002 - 2018 the average number of fire-related casualties per year is 2. The highest number of injuries - 6 took place in 2004, and the lowest - 0 in 2013. The data has a declining trend.
The average number of injuries per 1,000 fire incidents is 33. This indicator was the highest - 85 in 2008, and the lowest 0 in 2013. The trend for injuries per 1,000 fires is decreasing. Compared to the state value the number of casualties per 1,000 fire incidents is much higher.Casualties per 1,000 incidents in South Euclid, OH compared to nearest cities:
(Note: Based on data for all years, including only cities with at least 500 fire incidents)
| South Euclid: | 35.4 |
| University Heights: | 17.9 |
| Lyndhurst: | 12.4 |
| Cleveland Heights: | 16.1 |
| East Cleveland: | 13.0 |
| Beachwood: | 2.9 |
| Shaker Heights: | 49.0 |
| Mayfield Heights: | 5.3 |
| Euclid: | 15.5 |
 25.8% incidents where reported in the morning and 74.2% in the evening. The most fires (15.7%) took place on Monday, and the least (12.2%) on Friday.
 Based on the 1,130 fire incidents from years 2002 - 2018 most fires (11.1%) took place during June, and the least (5.8%) in January.
 Out of all 17,946 cases reported during the years 2002 - 2018, the most belonged to the categories: Rescue & EMS (56.6%), Hazardous Condition (15.8%), and False Alarm (12.7%).
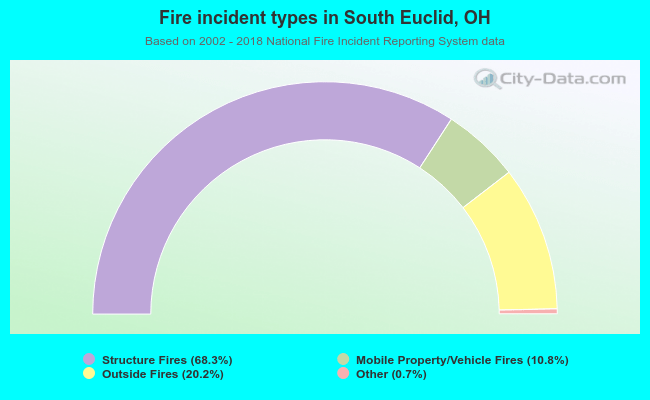 When looking into fire subcategories, the most incidents belonged to: Structure Fires (68.3%), and Outside Fires (20.2%).