Sound Beach: Fire Incidents, New York (NY)
Where are fire incidents reported in Sound Beach, NY
Something went wrong! Please refresh the page.
|
| |||||||||||||||||||||||||||||||||||||||||||||||||||||||||||||||||||||||||||||||||||||||||||||||||||||||||||||
2002 - 2018 National Fire Incident Reporting System (NFIRS) incidents
- Incident types reported to NFIRS in Sound Beach, NY
- 2,01063.0%Rescue & EMS
- 35511.1%Fire
- 2738.6%Hazardous Condition
- 2227.0%False Alarm
- 1936.1%Good Intent Call
- 1153.6%Service Call
- 140.4%Severe Weather
- 50.2%Special Incident
- Fire incident types reported to NFIRS in Sound Beach, NY
- 24067.6%Structure Fires
- 8022.5%Outside Fires
- 257.0%Mobile Property/Vehicle Fires
- 102.8%Other
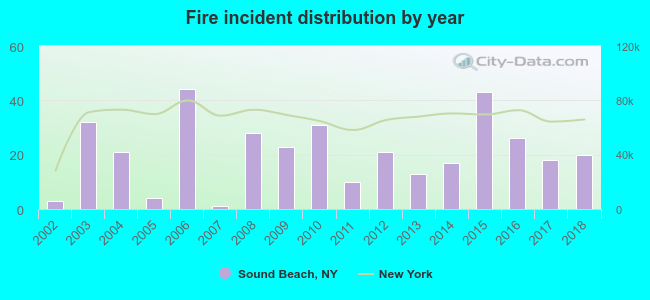 Based on the data from the years 2002 - 2018 the average number of fires per year is 21. The highest number of reported fires - 44 took place in 2006, and the least - 1 in 2007. The data has a rising trend.
The average number of yearly fire incidents per 10k residents in Sound Beach, NY compared to nearest cities:
(Note: Based on data for the last 3 years, including only cities with population 5,000 and above)
| Sound Beach: | 28.0 |
| Miller Place: | 19.5 |
| Rocky Point: | 30.2 |
| Mount Sinai: | 17.9 |
| Port Jefferson: | 22.5 |
| Coram: | 17.3 |
| Middle Island: | 38.8 |
| Terryville: | 1.7 |
| Ridge: | 25.5 |
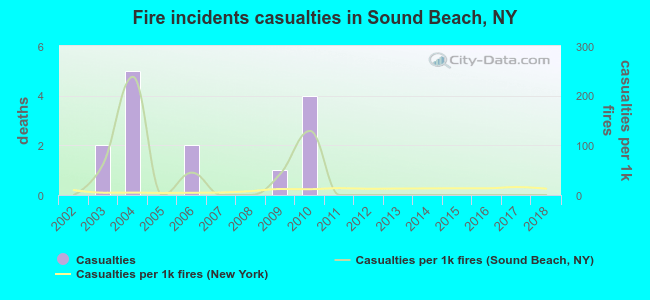 According to the data from the years 2002 - 2018 the average number of fire-related casualties per year is 1. The highest number of injuries - 5 took place in 2004, and the lowest - 0 in 2002. The data has a constant trend.
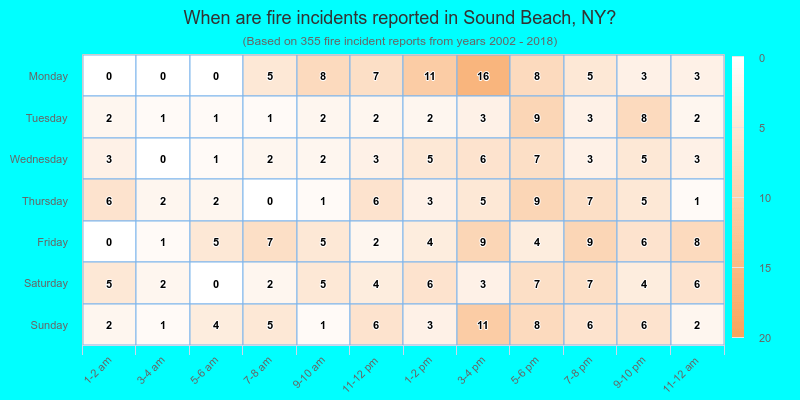
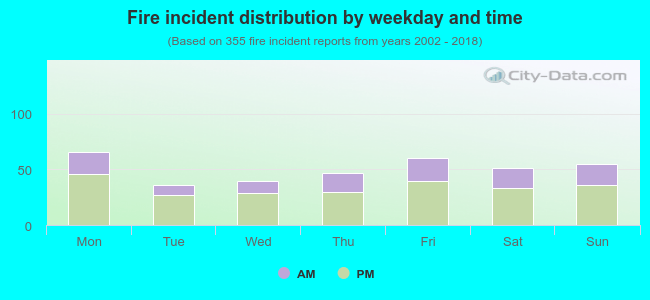 32.1% incidents where reported in the morning and 67.9% in the evening. The most fires (18.6%) took place on Monday, and the least (10.1%) on Tuesday.
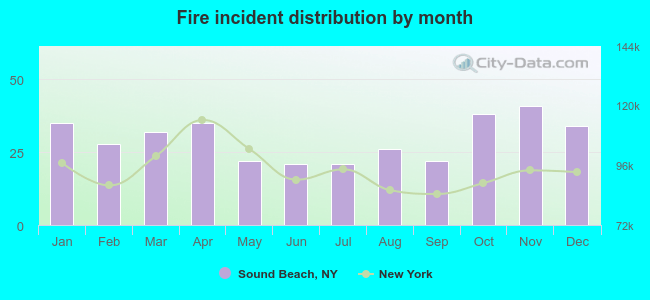 According to the 355 fires from years 2002 - 2018 most fires (11.5%) took place during November, and the least (5.9%) in June.
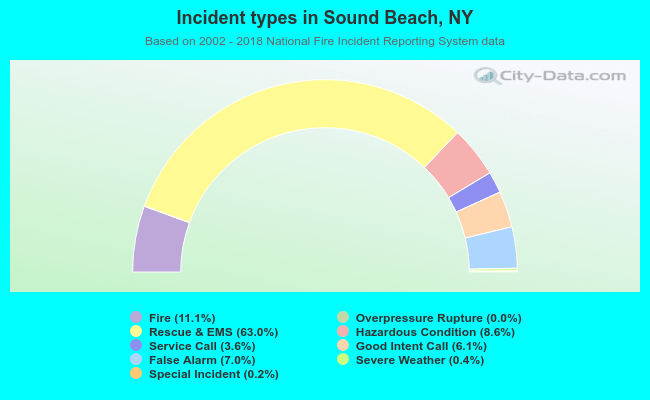 Out of all 3,188 cases reported during the years 2002 - 2018, the most belonged to the categories: Rescue & EMS (63.0%), Fire (11.1%), and Hazardous Condition (8.6%).
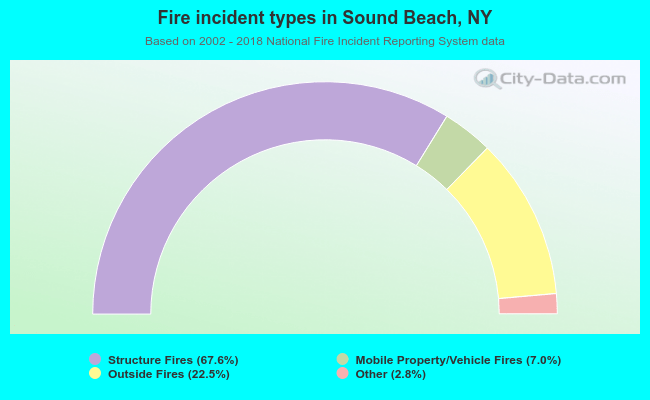 When looking into fire subcategories, the most incidents belonged to: Structure Fires (67.6%), and Outside Fires (22.5%).