Signal Mountain: Fire Incidents, Tennessee (TN)
Where are fire incidents reported in Signal Mountain, TN
Something went wrong! Please refresh the page.
|
| |||||||||||||||||||||||||||||||||||||||||||||||||||||||||||||||||||||||||||||||||||||||||||||||||||||||||||||
| Other | 45 | |||||||||||||||||||||||||||||||||||||||||||||||||||||||||||||||||||||||||||||||||||||||||||||||||||||||||||||
2002 - 2018 National Fire Incident Reporting System (NFIRS) incidents
- Incident types reported to NFIRS in Signal Mountain, TN
- 2,52143.9%Rescue & EMS
- 87315.2%Service Call
- 77513.5%Hazardous Condition
- 65711.4%Fire
- 5149.0%Good Intent Call
- 3355.8%False Alarm
- 450.8%Special Incident
- 170.3%Severe Weather
- Fire incident types reported to NFIRS in Signal Mountain, TN
- 28944.0%Outside Fires
- 24537.3%Structure Fires
- 7411.3%Mobile Property/Vehicle Fires
- 497.5%Other
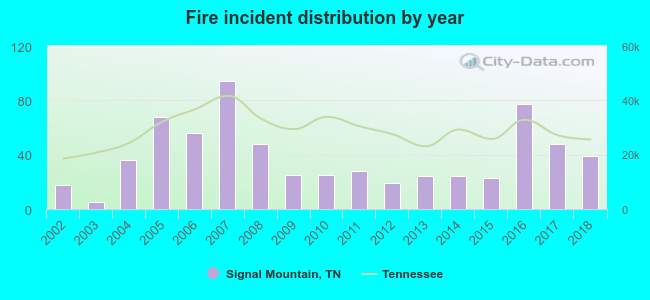 According to the data from the years 2002 - 2018 the average number of fire incidents per year is 39. The highest number of reported fire incidents - 94 took place in 2007, and the least - 5 in 2003. The data has a rising trend.
The average number of yearly fire incidents per 10k residents in Signal Mountain, TN compared to nearest cities:
(Note: Based on data for the last 3 years, including only cities with population 5,000 and above)
| Signal Mountain: | 64.2 |
| Red Bank: | 2.5 |
| Chattanooga: | 46.2 |
| East Ridge: | 50.4 |
| Harrison: | 9.9 |
| Dunlap: | 113.1 |
| Collegedale: | 15.5 |
| Sale Creek: | 8.3 |
| Cleveland: | 116.6 |
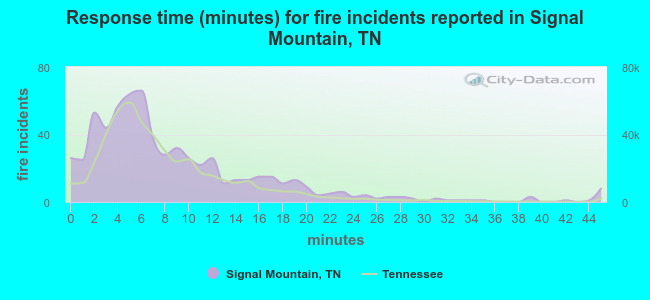 The median response time based on all reported fire incidents is 6 minutes. This is comparable to the Tennessee median value.
The median response time in Signal Mountain, TN compared to nearest cities:
(Note: Based on data for all years, including only cities with at least 500 fire incidents)
| Signal Mountain: | 6 minutes |
| Chattanooga: | 5 minutes |
| East Ridge: | 4 minutes |
| Rossville: | 9 minutes |
| Whitwell: | 11 minutes |
| Fort Oglethorpe: | 6 minutes |
| Ooltewah: | 8 minutes |
| Jasper: | 11 minutes |
| Dunlap: | 13 minutes |
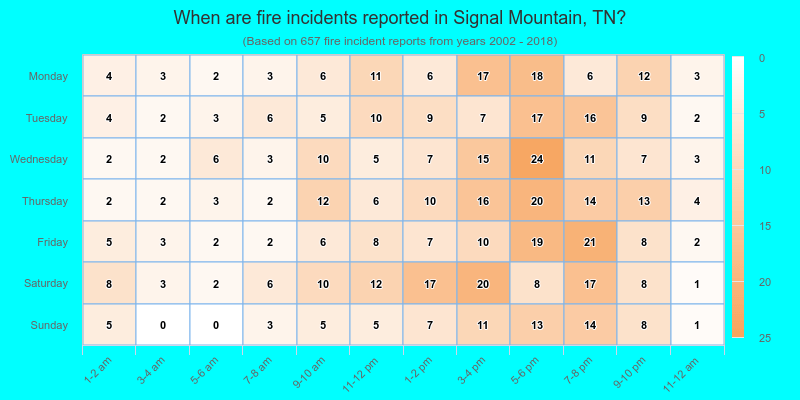
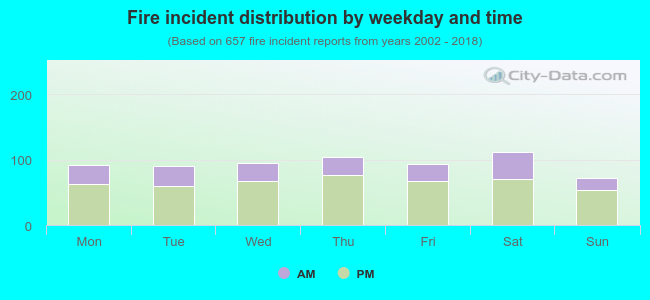 30.3% incidents where reported in the morning and 69.7% in the evening. The most fires (17.0%) took place on Saturday, and the least (11.0%) on Sunday.
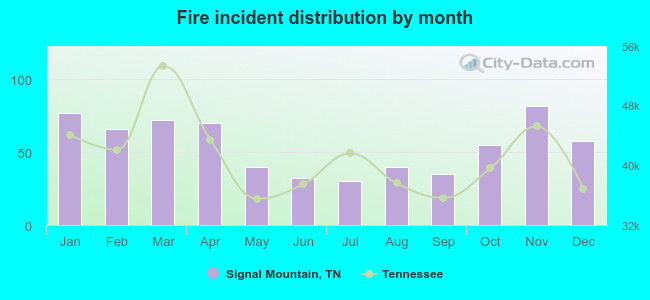 According to the 657 incident reports from years 2002 - 2018 most fires (12.5%) took place during November, and the least (4.6%) in July.
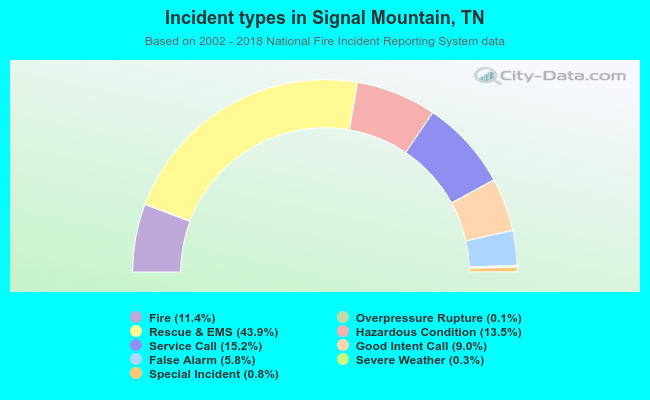 Out of all 5,741 cases reported during the years 2002 - 2018, the most belonged to the categories: Rescue & EMS (43.9%), Service Call (15.2%), and Hazardous Condition (13.5%).
 When looking into fire subcategories, the most incidents belonged to: Outside Fires (44.0%), and Structure Fires (37.3%).