Short Hills: Fire Incidents, New Jersey (NJ)
Where are fire incidents reported in Short Hills, NJ
Something went wrong! Please refresh the page.
| Fire incidents reported | |
|---|---|
| Sreet name | Count |
| MORRIS TPKE | 84 |
| OLD SHORT HILLS RD | 62 |
| MILLBURN AVE | 56 |
| HARTSHORN DR | 34 |
| HIGHLAND AVE | 34 |
| WHITE OAK RIDGE RD | 32 |
| HOBART AVE | 30 |
| ROUTE 124 | 28 |
| ROUTE 24 WESTBOUND | 26 |
| FARLEY RD | 24 |
| JEFFERSON AVE | 24 |
| FAIRFIELD DR | 20 |
| JOHN F. KENNEDY PKY | 20 |
| WESTERN DR | 20 |
| HEMLOCK RD | 18 |
| LONG HILL DR | 18 |
| WHITNEY RD | 18 |
| WOODFIELD DR | 18 |
| FOREST DR | 16 |
| LANCER DR | 16 |
| PARSONAGE HILL RD | 16 |
| WINDING WAY | 16 |
| WOODLAND RD | 16 |
| COLERIDGE RD | 14 |
| HARVEY DR | 14 |
| ATHENS RD | 12 |
| BROOKSIDE DR | 12 |
| BROWNING RD | 12 |
| CANOE BROOK RD | 12 |
| GREAT HILLS RD | 12 |
| Other | 122 |
2003 - 2018 National Fire Incident Reporting System (NFIRS) incidents
- Incident types reported to NFIRS in Short Hills, NJ
- 3,54238.3%Hazardous Condition
- 2,33925.3%False Alarm
- 1,23913.4%Service Call
- 8569.3%Fire
- 4925.3%Good Intent Call
- 4444.8%Rescue & EMS
- 2903.1%Severe Weather
- 260.3%Overpressure Rupture
- Fire incident types reported to NFIRS in Short Hills, NJ
- 59068.9%Structure Fires
- 14917.4%Outside Fires
- 9611.2%Mobile Property/Vehicle Fires
- 212.5%Other
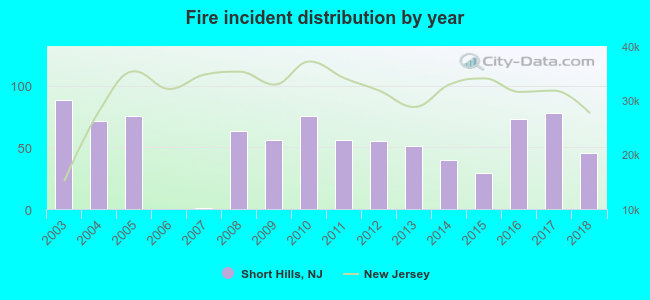 According to the data from the years 2003 - 2018 the average number of fires per year is 54. The highest number of reported fires - 88 took place in 2003, and the least - 0 in 2006. The data has a dropping trend.
The average number of yearly fire incidents per 10k residents in Short Hills, NJ compared to nearest cities:
(Note: Based on data for the last 3 years, including only cities with population 5,000 and above)
| Short Hills: | 49.6 |
| Millburn: | 10.6 |
| Livingston: | 15.4 |
| Summit: | 46.5 |
| Chatham: | 42.1 |
| Springfield: | 44.0 |
| Maplewood: | 42.0 |
| South Orange: | 24.3 |
| Florham Park: | 15.2 |
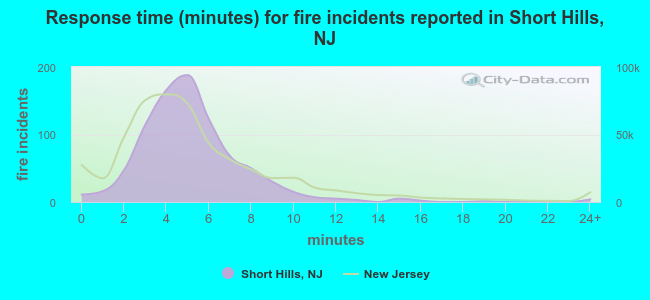 The median response time based on all reported fire incidents is 5 minutes. This is close to the state median value.
The median response time in Short Hills, NJ compared to nearest cities:
(Note: Based on data for all years, including only cities with at least 500 fire incidents)
| Short Hills: | 5 minutes |
| Millburn: | 4 minutes |
| Livingston: | 0 minutes |
| Summit: | 5 minutes |
| Springfield: | 5 minutes |
| Maplewood: | 3 minutes |
| South Orange: | 3 minutes |
| Union: | 5 minutes |
| West Orange: | 5 minutes |
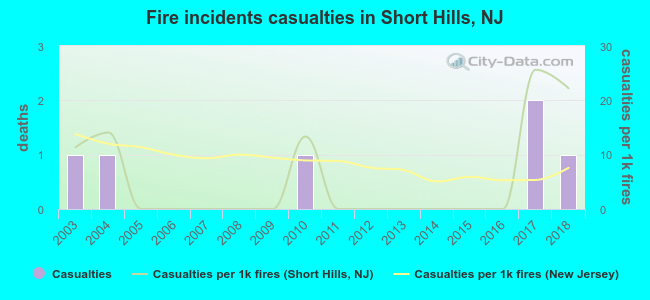 Based on the data from the years 2003 - 2018 the average number of fire-related casualties per year is 0. The highest number of injuries - 2 took place in 2017, and the lowest - 0 in 2005. The data has a constant trend.
The average number of injuries per 1,000 fires is 5. This indicator was the highest - 26 in 2017, and the lowest 0 in 2005. The trend for casualties per 1,000 fire incidents is increasing. Compared to the state value the number of casualties per 1,000 incidents is lower.
Based on the data from the years 2003 - 2018 the average number of fire-related casualties per year is 0. The highest number of injuries - 2 took place in 2017, and the lowest - 0 in 2005. The data has a constant trend.
The average number of injuries per 1,000 fires is 5. This indicator was the highest - 26 in 2017, and the lowest 0 in 2005. The trend for casualties per 1,000 fire incidents is increasing. Compared to the state value the number of casualties per 1,000 incidents is lower.Casualties per 1,000 incidents in Short Hills, NJ compared to nearest cities:
(Note: Based on data for all years, including only cities with at least 500 fire incidents)
| Short Hills: | 7.0 |
| Millburn: | 6.9 |
| Livingston: | 5.2 |
| Summit: | 15.8 |
| Springfield: | 6.7 |
| Maplewood: | 18.6 |
| South Orange: | 8.9 |
| Union: | 26.2 |
| West Orange: | 10.1 |
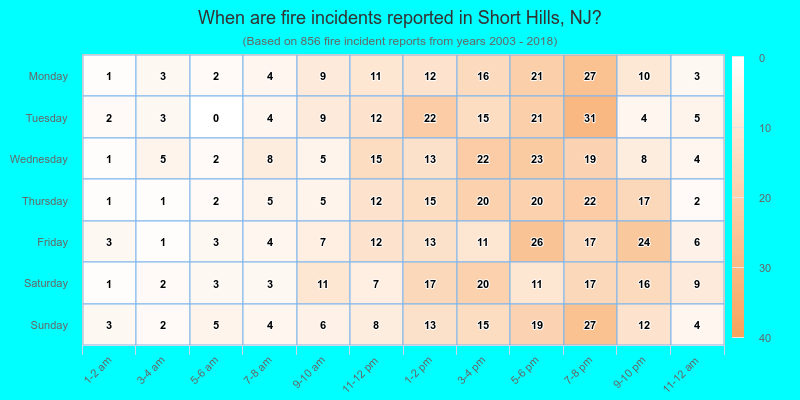
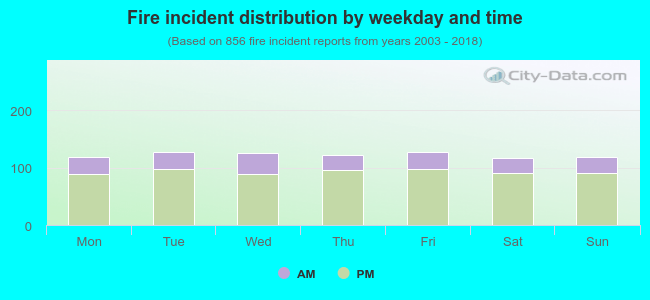 24.2% incidents where reported in the morning and 75.8% in the evening. The most fires (15.0%) took place on Tuesday, and the least (13.7%) on Saturday.
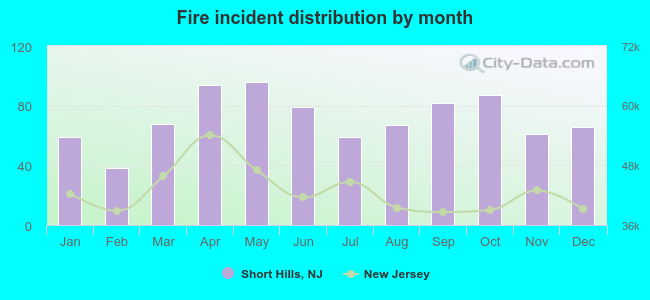 According to the 856 incident reports from years 2003 - 2018 most fires (11.2%) took place during May, and the least (4.4%) in February.
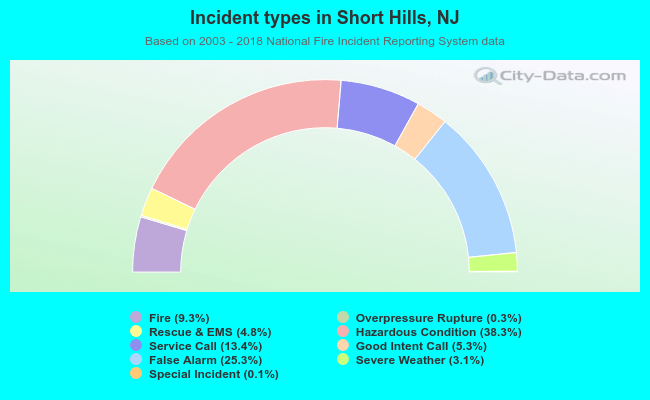 Out of all 9,236 cases reported during the years 2003 - 2018, the most belonged to the categories: Hazardous Condition (38.3%), False Alarm (25.3%), and Service Call (13.4%).
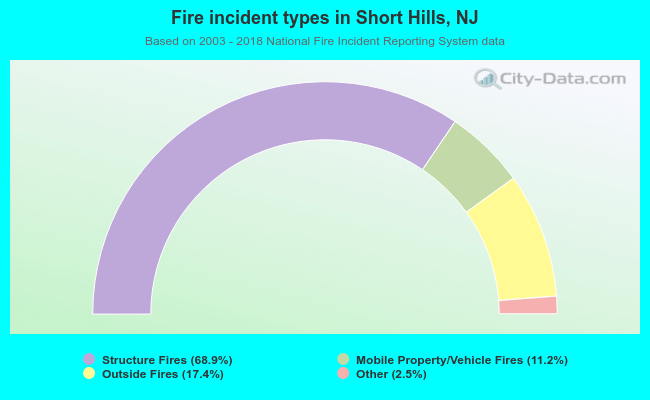 When looking into fire subcategories, the most reports belonged to: Structure Fires (68.9%), and Outside Fires (17.4%).