Shelby: Fire Incidents, Michigan (MI)
Where are fire incidents reported in Shelby, MI
Something went wrong! Please refresh the page.
|
| |||||||||||||||||||||||||||||||||||||||||||||||||||||||||||||||||||||||||||||||||||||||||||||||||||||||||||||
2002 - 2018 National Fire Incident Reporting System (NFIRS) incidents
- Incident types reported to NFIRS in Shelby, MI
- 49246.2%Fire
- 28226.5%Hazardous Condition
- 11711.0%Good Intent Call
- 908.4%Rescue & EMS
- 514.8%Service Call
- 292.7%False Alarm
- 30.3%Special Incident
- 20.2%Overpressure Rupture
- Fire incident types reported to NFIRS in Shelby, MI
- 22946.5%Structure Fires
- 14930.3%Outside Fires
- 7815.9%Mobile Property/Vehicle Fires
- 367.3%Other
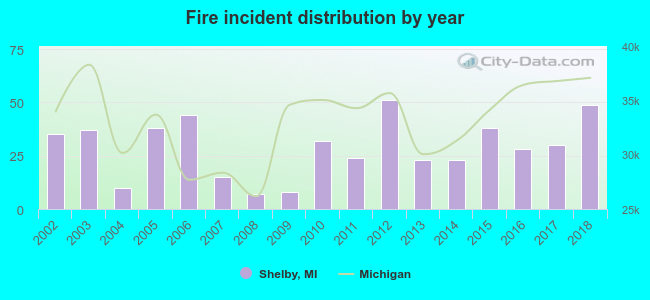 According to the data from the years 2002 - 2018 the average number of fire incidents per year is 29. The highest number of fires - 51 took place in 2012, and the least - 7 in 2008. The data has a growing trend.
The average number of yearly fire incidents per 10k residents in Shelby, MI compared to nearest cities:
(Note: Based on data for the last 3 years, including only cities with population 5,000 and above)
| Shelby: | 5.2 |
| Rochester: | 16.9 |
| Sterling Heights: | 18.3 |
| Rochester Hills: | 16.9 |
| Troy: | 21.2 |
| Mount Clemens: | 50.0 |
| Fraser: | 15.7 |
| Auburn Hills: | 44.6 |
| Clawson: | 16.0 |

 30.7% incidents where reported in the morning and 69.3% in the evening. The most fires (20.7%) took place on Monday, and the least (10.8%) on Tuesday.
 Based on the 492 fire incidents from years 2002 - 2018 most fires (16.1%) took place during April, and the least (3.5%) in October.
 Out of all 1,066 cases reported during the years 2002 - 2018, the most belonged to the categories: Fire (46.2%), Hazardous Condition (26.5%), and Good Intent Call (11.0%).
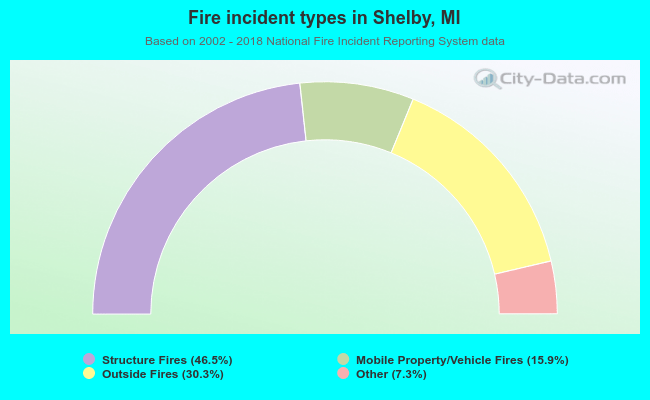 When looking into fire subcategories, the most reports belonged to: Structure Fires (46.5%), and Outside Fires (30.3%).