Seven Hills: Fire Incidents, Ohio (OH)
Where are fire incidents reported in Seven Hills, OH
Something went wrong! Please refresh the page.
|
| |||||||||||||||||||||||||||||||||||||||||||||||||||||||||||||||||||||||||||||||||||||||||||||||||||||||||||||
2002 - 2018 National Fire Incident Reporting System (NFIRS) incidents
- Incident types reported to NFIRS in Seven Hills, OH
- 5,06163.6%Rescue & EMS
- 1,01512.7%Service Call
- 87211.0%Hazardous Condition
- 4936.2%Fire
- 2923.7%False Alarm
- 2102.6%Good Intent Call
- 80.1%Overpressure Rupture
- Fire incident types reported to NFIRS in Seven Hills, OH
- 30762.3%Structure Fires
- 13627.6%Outside Fires
- 448.9%Mobile Property/Vehicle Fires
- 61.2%Other
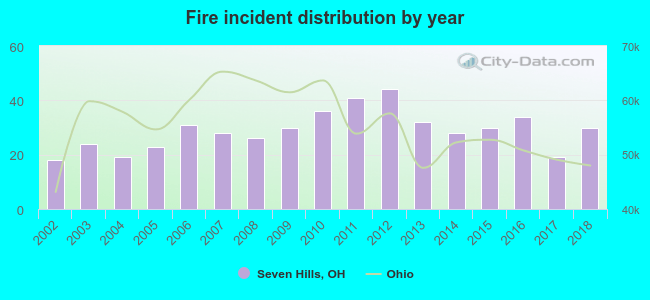 Based on the data from the years 2002 - 2018 the average number of fire incidents per year is 29. The highest number of fire incidents - 44 took place in 2012, and the least - 18 in 2002. The data has a rising trend.
The average number of yearly fire incidents per 10k residents in Seven Hills, OH compared to nearest cities:
(Note: Based on data for the last 3 years, including only cities with population 5,000 and above)
| Seven Hills: | 23.6 |
| Independence: | 55.6 |
| Parma: | 21.2 |
| Garfield Heights: | 32.2 |
| Broadview Heights: | 15.9 |
| Parma Heights: | 23.9 |
| Brooklyn: | 42.3 |
| North Royalton: | 19.5 |
| Brecksville: | 32.7 |
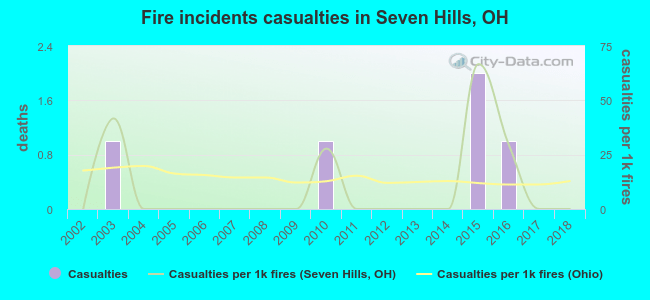 According to the reports from the years 2002 - 2018 the average number of fire-related yearly casualties is 0. The highest number of casualties - 2 took place in 2015, and the lowest - 0 in 2002. The data has a constant trend.
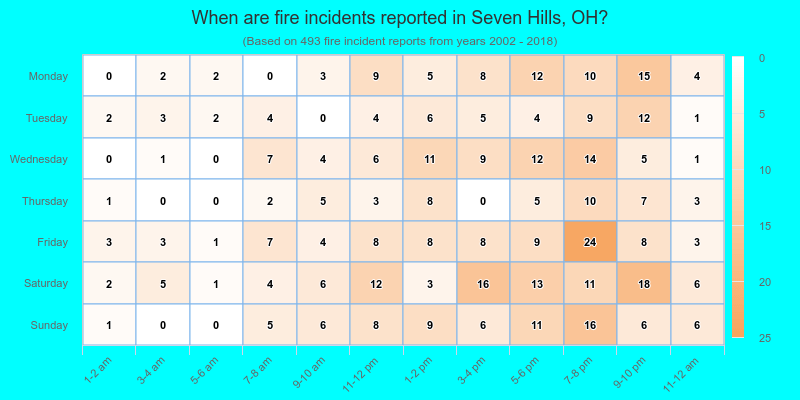
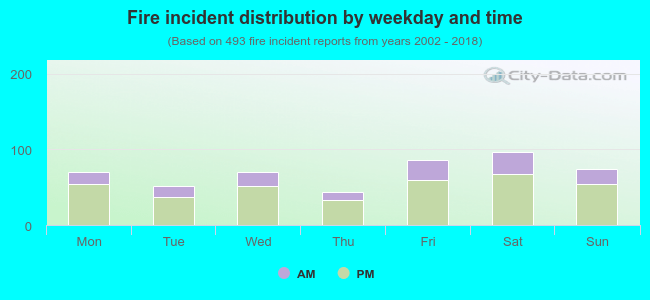 27.6% incidents where reported in the morning and 72.4% in the evening. The most fires (19.7%) took place on Saturday, and the least (8.9%) on Thursday.
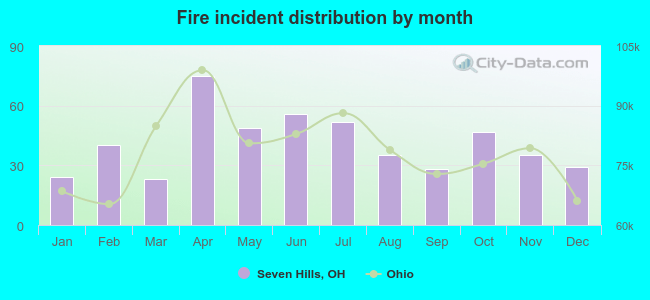 According to the 493 fires from years 2002 - 2018 most fires (15.2%) took place during April, and the least (4.7%) in March.
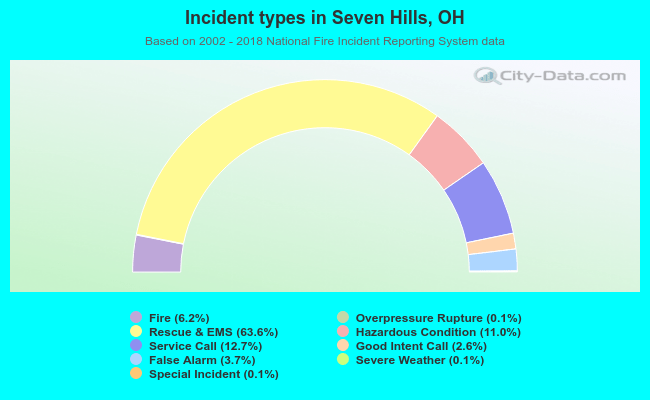 Out of all 7,963 cases reported during the years 2002 - 2018, the most belonged to the categories: Rescue & EMS (63.6%), Service Call (12.7%), and Hazardous Condition (11.0%).
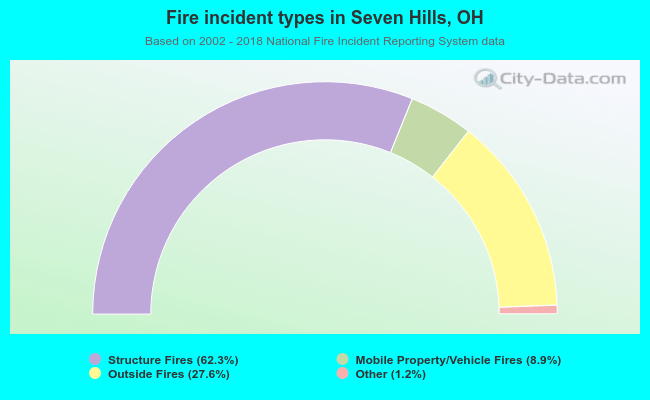 When looking into fire subcategories, the most incidents belonged to: Structure Fires (62.3%), and Outside Fires (27.6%).