Selma: Fire Incidents, Alabama (AL)
Where are fire incidents reported in Selma, AL
Something went wrong! Please refresh the page.
| Fire incidents reported | |
|---|---|
| Sreet name | Count |
| WATER AVE | 285 |
| HIGHLAND AVE | 261 |
| BROAD ST | 235 |
| ALABAMA AVE | 205 |
| DALLAS AVE | 200 |
| OLD MONTGOMERY HWY | 199 |
| WOODROW AVE | 190 |
| U S HWY 80 EAST | 180 |
| HIGHWAY 14 | 174 |
| MINTER AVE | 140 |
| LL ANDERSON | 135 |
| MARIE FOSTER | 130 |
| CIRCLE DRIVE | 128 |
| FIRST AVE | 125 |
| LAWRENCE ST | 120 |
| PHILPOT AVE | 120 |
| WASHINGTON ST | 120 |
| KING ST | 110 |
| CHURCH ST | 109 |
| LAUDERDALE STREET | 108 |
| GWC HOMES | 105 |
| MLK | 105 |
| GREEN ST | 99 |
| LAMAR AVE | 95 |
| SELMA AVE | 95 |
| U S HWY 80 E | 95 |
| U. S. HWY. 80 EAST | 87 |
| GRIFFIN AVE | 85 |
| MEDICAL CENTER PARKWAY PKY | 85 |
| CECIL JACKSON BYPASS | 84 |
2003 - 2018 National Fire Incident Reporting System (NFIRS) incidents
- Incident types reported to NFIRS in Selma, AL
- 3,01353.2%Fire
- 1,02418.1%Hazardous Condition
- 70912.5%Rescue & EMS
- 5379.5%False Alarm
- 1492.6%Service Call
- 1482.6%Good Intent Call
- 480.8%Overpressure Rupture
- 250.4%Special Incident
- 140.2%Severe Weather
- Fire incident types reported to NFIRS in Selma, AL
- 1,26742.1%Structure Fires
- 1,01033.5%Outside Fires
- 70323.3%Mobile Property/Vehicle Fires
- 331.1%Other
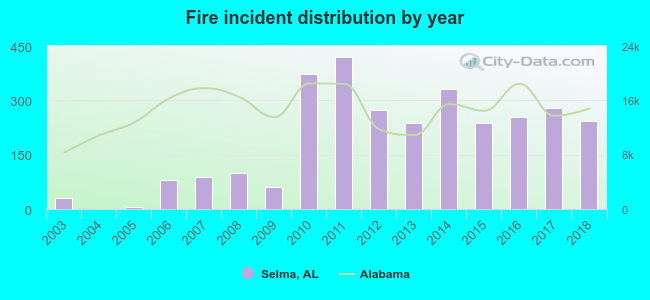 According to the data from the years 2003 - 2018 the average number of fires per year is 188. The highest number of reported fires - 421 took place in 2011, and the least - 0 in 2004. The data has an increasing trend.
The average number of yearly fire incidents per 10k residents in Selma, AL compared to nearest cities:
(Note: Based on data for the last 3 years, including only cities with population 5,000 and above)
| Selma: | 130.5 |
| Prattville: | 34.6 |
| Marbury: | 10.1 |
| Clanton: | 160.4 |
| Millbrook: | 27.7 |
| Hope Hull: | 3.4 |
| Montgomery: | 46.5 |
| Greenville: | 81.8 |
| Demopolis: | 40.4 |
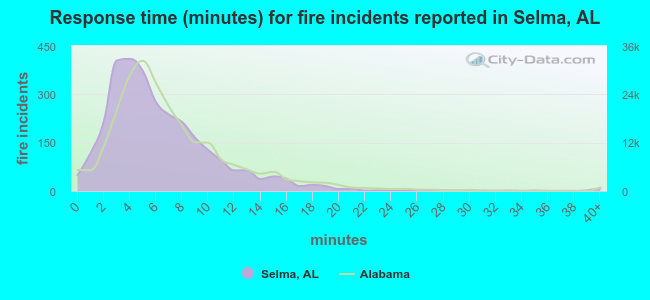 The median response time based on all reported fire incidents is 5 minutes. This is lower compared to the state median value.
The median response time in Selma, AL compared to nearest cities:
(Note: Based on data for all years, including only cities with at least 500 fire incidents)
| Selma: | 5 minutes |
| Prattville: | 6 minutes |
| Clanton: | 7 minutes |
| Millbrook: | 5 minutes |
| Jemison: | 10 minutes |
| Montgomery: | 4 minutes |
| Greenville: | 6 minutes |
| Wetumpka: | 7 minutes |
| Calera: | 6 minutes |
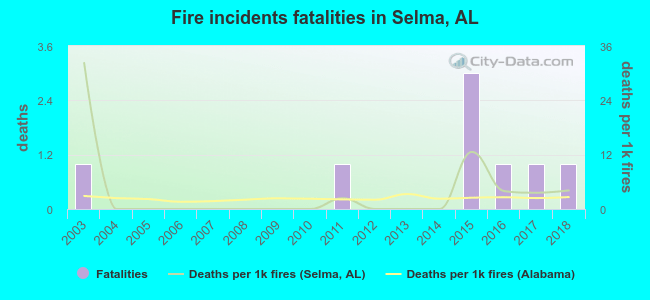 According to the reports from the years 2003 - 2018 the average number of fire-related yearly deaths is 1. The highest number of deaths - 3 took place in 2015, and the lowest - 0 in 2004. The data has a constant trend.
The average number of deaths per 1,000 fires is 4. This indicator was the highest - 32 in 2003, and the lowest 0 in 2004. The trend for deaths per 1,000 fires is declining. Compared to the state value the number of fatalities per 1,000 incidents is about the same.
According to the reports from the years 2003 - 2018 the average number of fire-related yearly deaths is 1. The highest number of deaths - 3 took place in 2015, and the lowest - 0 in 2004. The data has a constant trend.
The average number of deaths per 1,000 fires is 4. This indicator was the highest - 32 in 2003, and the lowest 0 in 2004. The trend for deaths per 1,000 fires is declining. Compared to the state value the number of fatalities per 1,000 incidents is about the same.Deaths per 1,000 incidents in Selma, AL compared to nearest cities:
(Note: Based on data for all years, including only cities with at least 2,500 fire incidents)
| Selma: | 2.7 |
| Montgomery: | 1.9 |
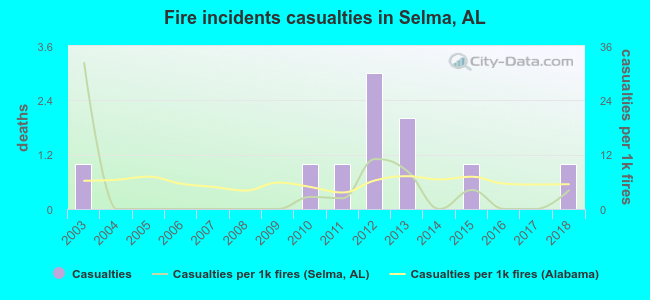 According to the reports from the years 2003 - 2018 the average number of fire-related yearly casualties is 1. The highest number of reported casualties - 3 took place in 2012, and the lowest - 0 in 2004. The data has a constant trend.
The average number of injuries per 1,000 fire incidents is 4. This indicator was the highest - 32 in 2003, and the lowest 0 in 2004. The trend for casualties per 1,000 fires is decreasing. Compared to the state value the number of injuries per 1,000 fires is lower.
According to the reports from the years 2003 - 2018 the average number of fire-related yearly casualties is 1. The highest number of reported casualties - 3 took place in 2012, and the lowest - 0 in 2004. The data has a constant trend.
The average number of injuries per 1,000 fire incidents is 4. This indicator was the highest - 32 in 2003, and the lowest 0 in 2004. The trend for casualties per 1,000 fires is decreasing. Compared to the state value the number of injuries per 1,000 fires is lower.Casualties per 1,000 incidents in Selma, AL compared to nearest cities:
(Note: Based on data for all years, including only cities with at least 500 fire incidents)
| Selma: | 3.3 |
| Prattville: | 6.7 |
| Clanton: | 8.0 |
| Millbrook: | 1.6 |
| Jemison: | 3.7 |
| Montgomery: | 6.1 |
| Greenville: | 3.9 |
| Wetumpka: | 4.8 |
| Calera: | 1.1 |
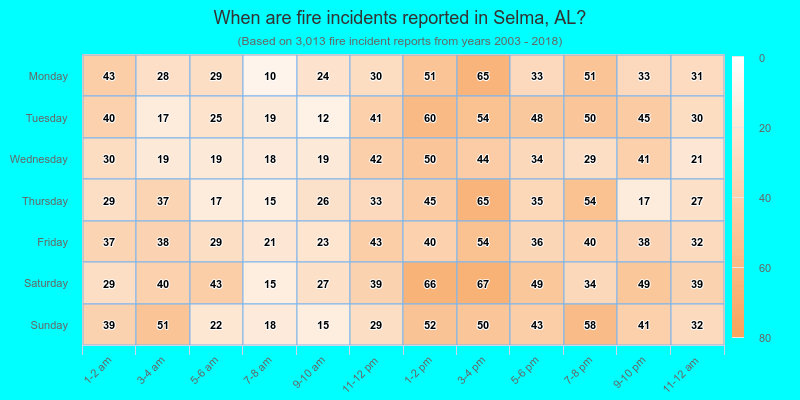
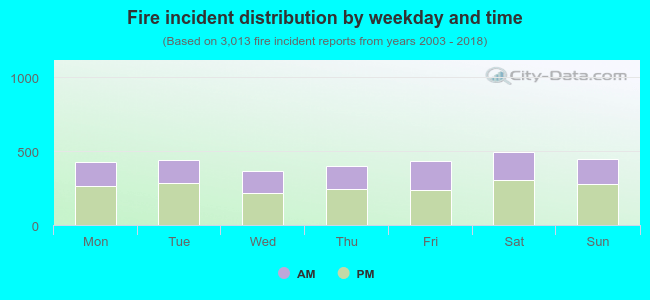 39.2% incidents where reported in the morning and 60.8% in the evening. The most fires (16.5%) took place on Saturday, and the least (12.1%) on Wednesday.
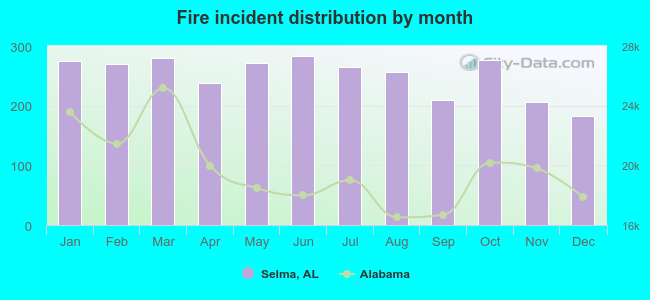 According to the 3,013 fire incident reports from years 2003 - 2018 most fires (9.4%) took place during June, and the least (6.0%) in December.
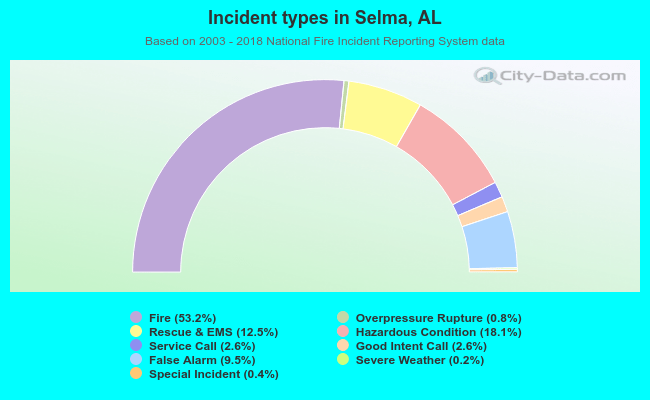 Out of all 5,667 cases reported during the years 2003 - 2018, the most belonged to the categories: Fire (53.2%), Hazardous Condition (18.1%), and Rescue & EMS (12.5%).
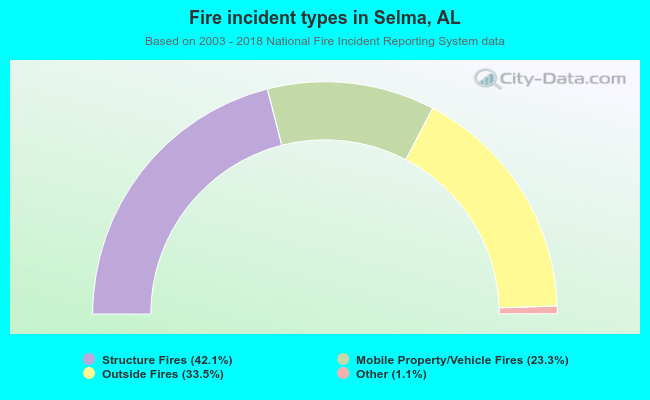 When looking into fire subcategories, the most incidents belonged to: Structure Fires (42.1%), and Outside Fires (33.5%).