Sayreville: Fire Incidents, New Jersey (NJ)
Where are fire incidents reported in Sayreville, NJ
Something went wrong! Please refresh the page.
| Fire incidents reported | |
|---|---|
| Sreet name | Count |
| WINDING WOODS DR | 322 |
| MAIN ST | 114 |
| GARDEN STATE PARKWAY | 90 |
| WASHINGTON RD | 70 |
| JERNEE MILL RD | 62 |
| BORDENTOWN AVE | 50 |
| WINDING WOOD | 50 |
| PRESIDENT PARK FIREHOUSE | 46 |
| WINDING WOODS | 44 |
| MACARTHUR AVE | 34 |
| FIRE ACADEMY DRIVE | 32 |
| SAYREVILLE BLVD | 30 |
| WINDING WOOD DR | 28 |
| WEBER AVE | 26 |
| MAIN STREET EXT | 22 |
| CROSSMAN RD | 20 |
| MELROSE FIREHOUSE | 18 |
| MORGAN FIREHOUSE | 18 |
| WINDING WOODS DRIVE | 18 |
| WINDING WOODS WAY | 18 |
| BORDENTOWN | 16 |
| CHARLES ST | 14 |
| RARITAN ST | 14 |
| SCARLET DR | 14 |
| CREAMER DR | 12 |
| MINISINK AVE | 12 |
| PULASKI AVE | 12 |
| QUAID AVE | 12 |
| TELEGRAPH LN | 12 |
| WILLIAM ST | 12 |
2002 - 2018 National Fire Incident Reporting System (NFIRS) incidents
- Incident types reported to NFIRS in Sayreville, NJ
- 1,04238.3%Fire
- 98536.2%Hazardous Condition
- 36913.5%False Alarm
- 1455.3%Service Call
- 1164.3%Good Intent Call
- 531.9%Rescue & EMS
- 70.3%Special Incident
- 50.2%Overpressure Rupture
- Fire incident types reported to NFIRS in Sayreville, NJ
- 45743.9%Structure Fires
- 40038.4%Outside Fires
- 15314.7%Mobile Property/Vehicle Fires
- 323.1%Other
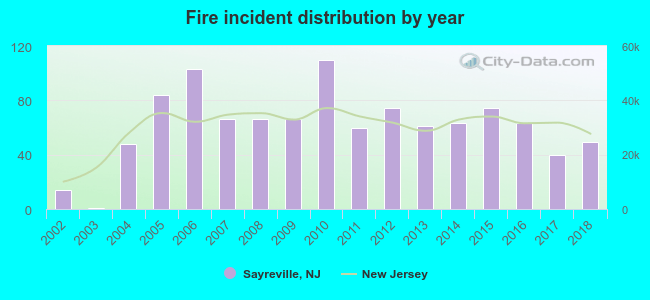 Based on the data from the years 2002 - 2018 the average number of fires per year is 61. The highest number of fire incidents - 110 took place in 2010, and the least - 1 in 2003. The data has a growing trend.
The average number of yearly fire incidents per 10k residents in Sayreville, NJ compared to nearest cities:
(Note: Based on data for the last 3 years, including only cities with population 5,000 and above)
| Sayreville: | 11.2 |
| South Amboy: | 51.2 |
| South River: | 15.5 |
| Laurence Harbor: | 5.4 |
| Perth Amboy: | 32.8 |
| Old Bridge: | 38.9 |
| East Brunswick: | 18.2 |
| Fords: | 1.1 |
| Metuchen: | 13.7 |
 The median response time based on all reported fire incidents is 5 minutes. This is comparable to the state median value.
The median response time in Sayreville, NJ compared to nearest cities:
(Note: Based on data for all years, including only cities with at least 500 fire incidents)
| Sayreville: | 5 minutes |
| South Amboy: | 3 minutes |
| Perth Amboy: | 4 minutes |
| Old Bridge: | 4 minutes |
| East Brunswick: | 5 minutes |
| Highland Park: | 2 minutes |
| Matawan: | 4 minutes |
| Woodbridge: | 5 minutes |
| New Brunswick: | 3 minutes |
 According to the reports from the years 2002 - 2018 the average number of fire-related yearly casualties is 1. The highest number of casualties - 6 took place in 2014, and the lowest - 0 in 2002. The data has a constant trend.
The average number of injuries per 1,000 fire incidents is 16. This indicator was the highest - 95 in 2014, and the lowest 0 in 2002. The trend for injuries per 1,000 incidents is constant. Compared to the New Jersey value the number of casualties per 1,000 fire incidents is much higher.
According to the reports from the years 2002 - 2018 the average number of fire-related yearly casualties is 1. The highest number of casualties - 6 took place in 2014, and the lowest - 0 in 2002. The data has a constant trend.
The average number of injuries per 1,000 fire incidents is 16. This indicator was the highest - 95 in 2014, and the lowest 0 in 2002. The trend for injuries per 1,000 incidents is constant. Compared to the New Jersey value the number of casualties per 1,000 fire incidents is much higher.Casualties per 1,000 incidents in Sayreville, NJ compared to nearest cities:
(Note: Based on data for all years, including only cities with at least 500 fire incidents)
| Sayreville: | 17.3 |
| South Amboy: | 13.2 |
| Perth Amboy: | 45.4 |
| Old Bridge: | 9.9 |
| East Brunswick: | 7.0 |
| Highland Park: | 7.3 |
| Matawan: | 8.2 |
| Woodbridge: | 15.2 |
| New Brunswick: | 11.6 |
 27.2% incidents where reported in the morning and 72.8% in the evening. The most fires (16.3%) took place on Sunday, and the least (13.1%) on Tuesday.
 According to the 1,042 fire incidents from years 2002 - 2018 most fires (12.7%) took place during April, and the least (6.0%) in November.
 Out of all 2,724 cases reported during the years 2002 - 2018, the most belonged to the categories: Fire (38.3%), Hazardous Condition (36.2%), and False Alarm (13.5%).
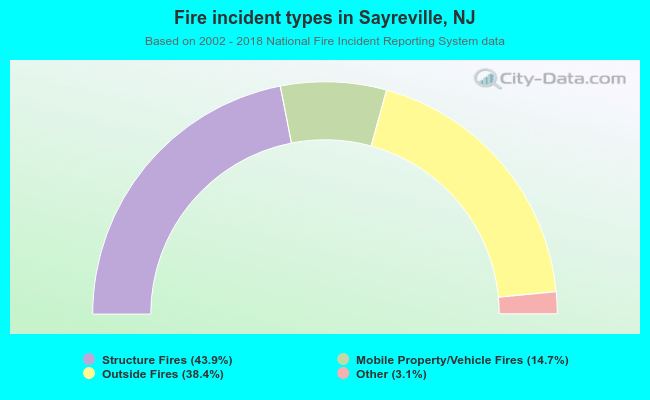 When looking into fire subcategories, the most reports belonged to: Structure Fires (43.9%), and Outside Fires (38.4%).