Salisbury: Fire Incidents, Maryland (MD)
Where are fire incidents reported in Salisbury, MD
Something went wrong! Please refresh the page.
| Fire incidents reported | |
|---|---|
| Sreet name | Count |
| SALISBURY BLVD | 774 |
| DIVISION ST | 224 |
| OCEAN GTWY | 140 |
| MAIN ST | 138 |
| CHURCH ST | 130 |
| MT HERMON RD | 112 |
| CAMDEN AVE | 94 |
| NAYLOR MILL RD | 90 |
| SNOW HILL RD | 88 |
| SALISBURY BYP | 86 |
| COLLEGE AVE | 84 |
| SCHUMAKER DR | 82 |
| WEST RD | 82 |
| RIVERSIDE DR | 80 |
| CIVIC AVE | 76 |
| NANTICOKE RD | 76 |
| JOHNSON RD | 74 |
| FAIRGROUND DR | 72 |
| ADAMS AVE | 64 |
| JERSEY RD | 60 |
| BOOTH ST | 58 |
| OLD OCEAN CITY RD | 58 |
| SALISBURY PKWY | 58 |
| SALISBURY PKY | 56 |
| BEAGLIN PARK DR | 54 |
| NORTHWOOD DR | 54 |
| TRUITT ST | 54 |
| WESTOVER DR | 54 |
| ZION RD | 54 |
| DELAWARE AVE | 50 |
| Other | 1,293 |
2002 - 2018 National Fire Incident Reporting System (NFIRS) incidents
- Incident types reported to NFIRS in Salisbury, MD
- 10,05641.0%Rescue & EMS
- 4,46918.2%Fire
- 4,08716.6%Hazardous Condition
- 2,69611.0%False Alarm
- 1,7447.1%Good Intent Call
- 1,3295.4%Service Call
- 780.3%Overpressure Rupture
- 590.2%Special Incident
- 350.1%Severe Weather
- Fire incident types reported to NFIRS in Salisbury, MD
- 1,88942.3%Outside Fires
- 1,70338.1%Structure Fires
- 55212.4%Mobile Property/Vehicle Fires
- 3257.3%Other
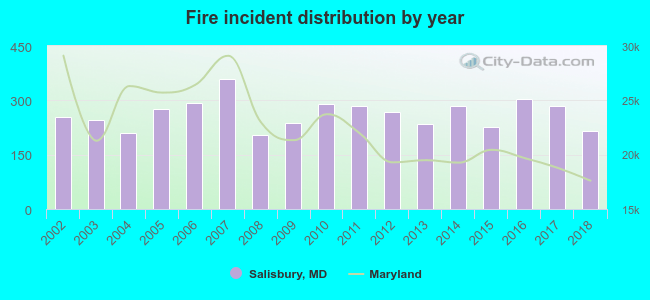 Based on the data from the years 2002 - 2018 the average number of fire incidents per year is 263. The highest number of reported fire incidents - 358 took place in 2007, and the least - 204 in 2008. The data has a declining trend.
The average number of yearly fire incidents per 10k residents in Salisbury, MD compared to nearest cities:
(Note: Based on data for the last 3 years, including only cities with population 5,000 and above)
| Salisbury: | 82.1 |
| Fruitland: | 78.1 |
| Ocean Pines: | 7.4 |
| Ocean City: | 153.8 |
| Cambridge: | 103.4 |
 The median response time based on all reported fire incidents is 5 minutes. This is lower compared to the Maryland median value.
The median response time in Salisbury, MD compared to nearest cities:
(Note: Based on data for all years, including only cities with at least 500 fire incidents)
| Salisbury: | 5 minutes |
| Fruitland: | 8 minutes |
| Delmar: | 8 minutes |
| Hebron: | 9 minutes |
| Delmar: | 9 minutes |
| Princess Anne: | 11 minutes |
| Laurel: | 10 minutes |
| Seaford: | 7 minutes |
| Pocomoke City: | 7 minutes |
 Based on the reports from the years 2002 - 2018 the average number of fire-related yearly deaths is 1. The highest number of reported deaths - 3 took place in 2007, and the lowest - 0 in 2002. The data has a constant trend.
The average number of deaths per 1,000 fires is 2. This indicator was the highest - 11 in 2014, and the lowest 0 in 2002. The trend for fatalities per 1,000 incidents is constant. Compared to the state value the number of deaths per 1,000 fires is about the same.
Based on the reports from the years 2002 - 2018 the average number of fire-related yearly deaths is 1. The highest number of reported deaths - 3 took place in 2007, and the lowest - 0 in 2002. The data has a constant trend.
The average number of deaths per 1,000 fires is 2. This indicator was the highest - 11 in 2014, and the lowest 0 in 2002. The trend for fatalities per 1,000 incidents is constant. Compared to the state value the number of deaths per 1,000 fires is about the same.Deaths per 1,000 incidents in Salisbury, MD compared to nearest cities:
(Note: Based on data for all years, including only cities with at least 2,500 fire incidents)
| Salisbury: | 2.0 |
 Based on the data from the years 2002 - 2018 the average number of fire-related yearly casualties is 1. The highest number of reported casualties - 3 took place in 2007, and the lowest - 0 in 2005. The data has a decreasing trend.
The average number of injuries per 1,000 fires is 3. This indicator was the highest - 10 in 2004, and the lowest 0 in 2005. The trend for casualties per 1,000 fires is decreasing. Compared to the Maryland value the number of injuries per 1,000 fires is much lower.
Based on the data from the years 2002 - 2018 the average number of fire-related yearly casualties is 1. The highest number of reported casualties - 3 took place in 2007, and the lowest - 0 in 2005. The data has a decreasing trend.
The average number of injuries per 1,000 fires is 3. This indicator was the highest - 10 in 2004, and the lowest 0 in 2005. The trend for casualties per 1,000 fires is decreasing. Compared to the Maryland value the number of injuries per 1,000 fires is much lower.Casualties per 1,000 incidents in Salisbury, MD compared to nearest cities:
(Note: Based on data for all years, including only cities with at least 500 fire incidents)
| Salisbury: | 2.7 |
| Fruitland: | 0.0 |
| Delmar: | 0.0 |
| Hebron: | 0.0 |
| Delmar: | 1.4 |
| Princess Anne: | 0.8 |
| Laurel: | 0.7 |
| Seaford: | 1.0 |
| Pocomoke City: | 1.6 |
 30.5% incidents where reported in the morning and 69.5% in the evening. The most fires (16.0%) took place on Saturday, and the least (13.0%) on Wednesday.
 Based on the 4,469 fire incidents from years 2002 - 2018 most fires (11.8%) took place during April, and the least (6.4%) in September.
 Out of all 24,553 cases reported during the years 2002 - 2018, the most belonged to the categories: Rescue & EMS (41.0%), Fire (18.2%), and Hazardous Condition (16.6%).
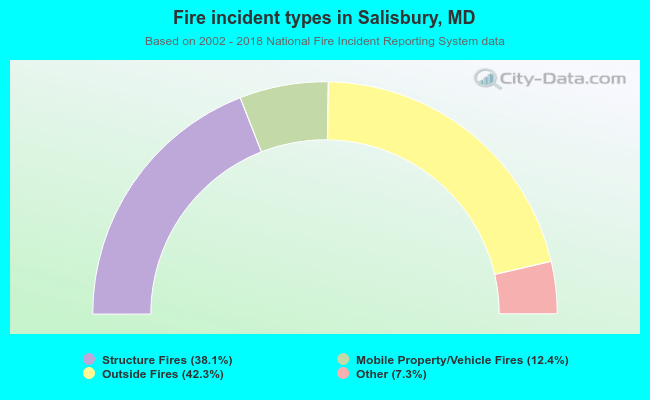 When looking into fire subcategories, the most incidents belonged to: Outside Fires (42.3%), and Structure Fires (38.1%).