Saline: Fire Incidents, Michigan (MI)
Where are fire incidents reported in Saline, MI
Something went wrong! Please refresh the page.
|
| |||||||||||||||||||||||||||||||||||||||||||||||||||||||||||||||||||||||||||||||||||||||||||||||||||||||||||||
| Other | 195 | |||||||||||||||||||||||||||||||||||||||||||||||||||||||||||||||||||||||||||||||||||||||||||||||||||||||||||||
2002 - 2018 National Fire Incident Reporting System (NFIRS) incidents
- Incident types reported to NFIRS in Saline, MI
- 3,40050.4%Rescue & EMS
- 1,02215.1%Hazardous Condition
- 1,01115.0%Good Intent Call
- 5257.8%Fire
- 4546.7%False Alarm
- 3224.8%Service Call
- 90.1%Overpressure Rupture
- Fire incident types reported to NFIRS in Saline, MI
- 20338.7%Structure Fires
- 17533.3%Outside Fires
- 7915.0%Other
- 6813.0%Mobile Property/Vehicle Fires
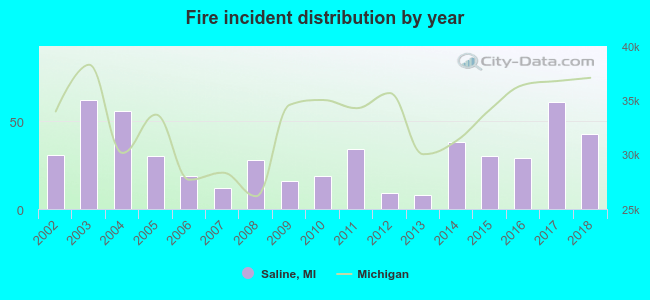 Based on the data from the years 2002 - 2018 the average number of fires per year is 31. The highest number of fire incidents - 62 took place in 2003, and the least - 8 in 2013. The data has a rising trend.
The average number of yearly fire incidents per 10k residents in Saline, MI compared to nearest cities:
(Note: Based on data for the last 3 years, including only cities with population 5,000 and above)
| Saline: | 48.4 |
| Ann Arbor: | 29.5 |
| Milan: | 71.1 |
| Ypsilanti: | 189.9 |
| Tecumseh: | 26.2 |
| Chelsea: | 85.7 |
| Whitmore Lake: | 81.0 |
| Canton: | 16.6 |
| Plymouth Township: | 2.4 |
 The median response time based on all reported fire incidents is 6 minutes. This is similar to the Michigan median value.
The median response time in Saline, MI compared to nearest cities:
(Note: Based on data for all years, including only cities with at least 500 fire incidents)
| Saline: | 6 minutes |
| Ann Arbor: | 5 minutes |
| Milan: | 10 minutes |
| Ypsilanti: | 5 minutes |
| Dexter: | 8 minutes |
| Manchester: | 11 minutes |
| Tecumseh: | 8 minutes |
| Belleville: | 7 minutes |
| Chelsea: | 8 minutes |
 30.1% incidents where reported in the morning and 69.9% in the evening. The most fires (16.6%) took place on Friday, and the least (11.4%) on Monday.
 According to the 525 reports from years 2002 - 2018 most fires (15.2%) took place during April, and the least (3.6%) in January.
 Out of all 6,752 cases reported during the years 2002 - 2018, the most belonged to the categories: Rescue & EMS (50.4%), Hazardous Condition (15.1%), and Good Intent Call (15.0%).
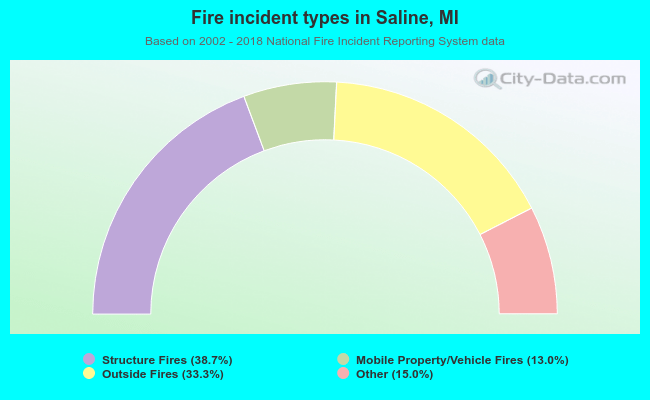 When looking into fire subcategories, the most reports belonged to: Structure Fires (38.7%), and Outside Fires (33.3%).