Salem: Fire Incidents, Virginia (VA)
Where are fire incidents reported in Salem, VA
Something went wrong! Please refresh the page.
| Fire incidents reported | |
|---|---|
| Sreet name | Count |
| WEST MAIN ST | 184 |
| 81 | 170 |
| MAIN ST | 170 |
| ELECTRIC RD | 134 |
| BRADSHAW RD | 92 |
| APPERSON DR | 76 |
| EAST MAIN ST | 64 |
| BOULEVARD - ROANOKE | 48 |
| SALEM INDUSTRIAL DR | 44 |
| KIMBALL AVE | 38 |
| WILDWOOD RD | 38 |
| INDIANA ST | 36 |
| YORKSHIRE ST | 34 |
| AAAAAA ST | 32 |
| CATAWBA VALLEY DR | 32 |
| ROANOKE BLVD | 30 |
| BRAEBURN DR | 28 |
| LANCING DR | 28 |
| COLORADO STREET - | 26 |
| POOR MOUNTAIN RD | 26 |
| RIVERSIDE DR | 26 |
| RUTLEDGE DR | 26 |
| UNION ST | 26 |
| THOMPSON MEMORIAL DR | 24 |
| ALLEGHANY DR | 22 |
| CRAIG AVE | 22 |
| FLORIDA ST | 22 |
| LYNCHBURG TPKE | 22 |
| MARKET ST | 22 |
| KESSLER MILL RD | 20 |
| Other | 136 |
2002 - 2018 National Fire Incident Reporting System (NFIRS) incidents
- Incident types reported to NFIRS in Salem, VA
- 15,35868.3%Rescue & EMS
- 2,34910.5%Hazardous Condition
- 1,6987.6%Fire
- 1,1895.3%False Alarm
- 9874.4%Service Call
- 8233.7%Good Intent Call
- 350.2%Overpressure Rupture
- 280.1%Special Incident
- Fire incident types reported to NFIRS in Salem, VA
- 66138.9%Structure Fires
- 63537.4%Outside Fires
- 28917.0%Mobile Property/Vehicle Fires
- 1136.7%Other
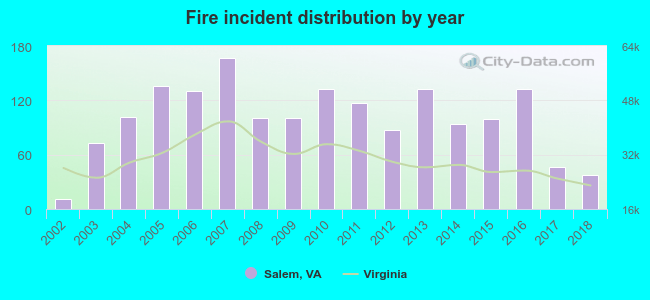 Based on the data from the years 2002 - 2018 the average number of fire incidents per year is 100. The highest number of fire incidents - 167 took place in 2007, and the least - 11 in 2002. The data has an increasing trend.
The average number of yearly fire incidents per 10k residents in Salem, VA compared to nearest cities:
(Note: Based on data for the last 3 years, including only cities with population 5,000 and above)
| Salem: | 28.3 |
| Roanoke: | 50.6 |
| Hollins: | 1.4 |
| Vinton: | 79.9 |
| Blacksburg: | 22.0 |
| Christiansburg: | 55.5 |
| Bedford: | 163.4 |
| Radford: | 30.4 |
| Covington: | 69.5 |
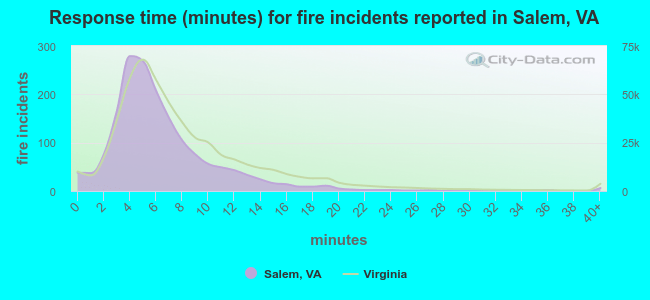 The median response time based on all reported fire incidents is 5 minutes. This is lower than the Virginia median value.
The median response time in Salem, VA compared to nearest cities:
(Note: Based on data for all years, including only cities with at least 500 fire incidents)
| Salem: | 5 minutes |
| Roanoke: | 5 minutes |
| Vinton: | 10 minutes |
| Troutville: | 9 minutes |
| Blue Ridge: | 11 minutes |
| Blacksburg: | 5 minutes |
| Christiansburg: | 7 minutes |
| Rocky Mount: | 10 minutes |
| Buchanan: | 14 minutes |
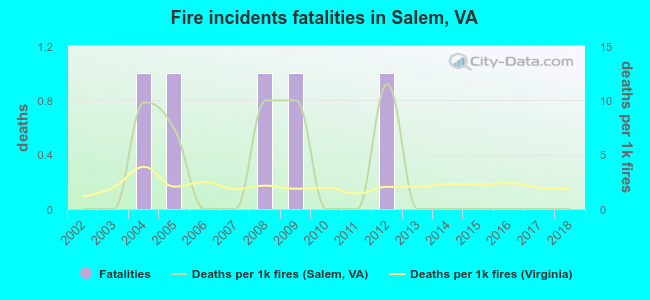 According to the reports from the years 2002 - 2018 the average number of fire-related fatalities per year is 0. The highest number of reported deaths - 1 took place in 2004, and the lowest - 0 in 2002. The data has a constant trend.
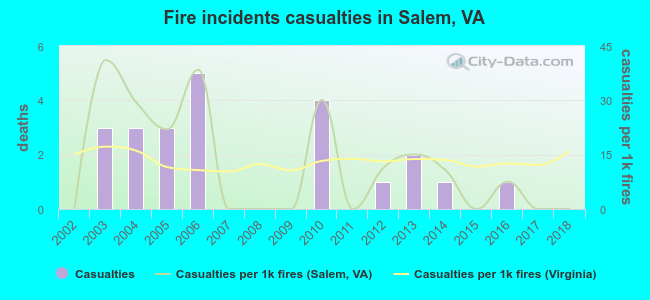 According to the data from the years 2002 - 2018 the average number of fire-related yearly casualties is 1. The highest number of reported injuries - 5 took place in 2006, and the lowest - 0 in 2002. The data has a constant trend.
The average number of injuries per 1,000 fire incidents is 12. This indicator was the highest - 41 in 2003, and the lowest 0 in 2002. The trend for casualties per 1,000 fires is decreasing. Compared to the Virginia value the number of injuries per 1,000 fire incidents is similar.
According to the data from the years 2002 - 2018 the average number of fire-related yearly casualties is 1. The highest number of reported injuries - 5 took place in 2006, and the lowest - 0 in 2002. The data has a constant trend.
The average number of injuries per 1,000 fire incidents is 12. This indicator was the highest - 41 in 2003, and the lowest 0 in 2002. The trend for casualties per 1,000 fires is decreasing. Compared to the Virginia value the number of injuries per 1,000 fire incidents is similar.Casualties per 1,000 incidents in Salem, VA compared to nearest cities:
(Note: Based on data for all years, including only cities with at least 500 fire incidents)
| Salem: | 13.5 |
| Roanoke: | 30.3 |
| Vinton: | 1.8 |
| Troutville: | 1.3 |
| Blue Ridge: | 4.0 |
| Blacksburg: | 13.3 |
| Christiansburg: | 1.0 |
| Rocky Mount: | 1.2 |
| Buchanan: | 0.0 |
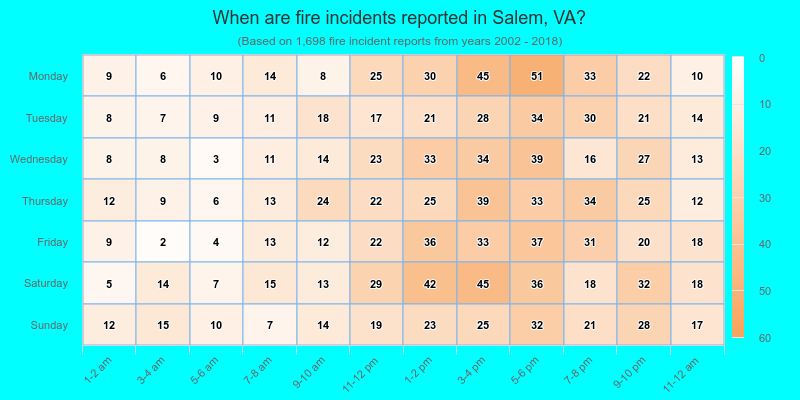
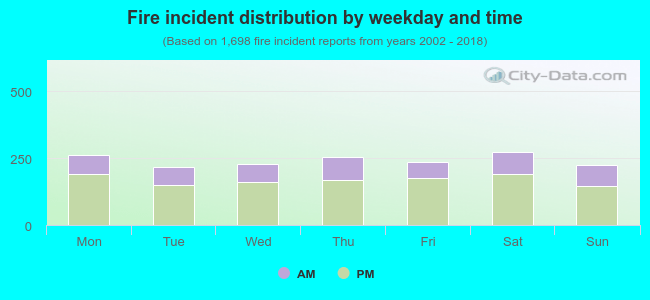 30.4% incidents where reported in the morning and 69.6% in the evening. The most fires (16.1%) took place on Saturday, and the least (12.8%) on Tuesday.
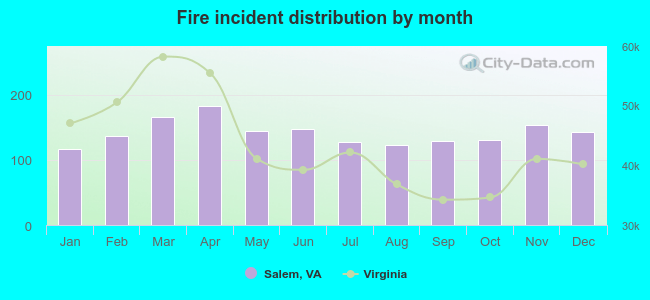 Based on the 1,698 incident reports from years 2002 - 2018 most fires (10.8%) took place during April, and the least (6.9%) in January.
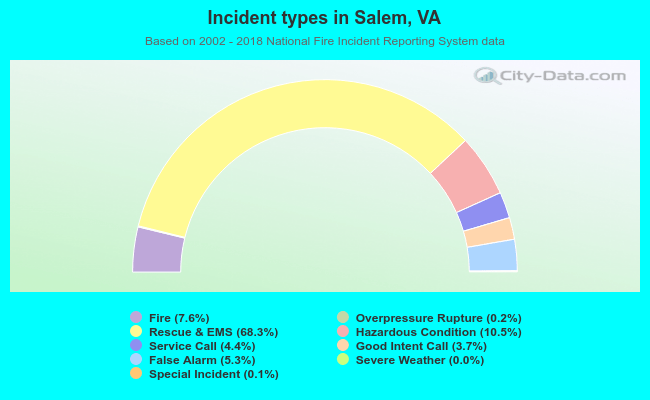 Out of all 22,474 cases reported during the years 2002 - 2018, the most belonged to the categories: Rescue & EMS (68.3%), Hazardous Condition (10.5%), and Fire (7.6%).
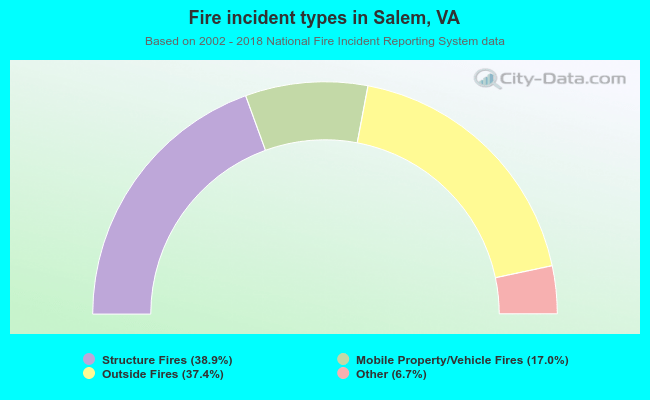 When looking into fire subcategories, the most incidents belonged to: Structure Fires (38.9%), and Outside Fires (37.4%).