Russellville: Fire Incidents, Arkansas (AR)
Where are fire incidents reported in Russellville, AR
Something went wrong! Please refresh the page.
| Fire incidents reported | |
|---|---|
| Sreet name | Count |
| ARKANSAS AVE | 470 |
| MAIN ST | 384 |
| TYLER RD | 136 |
| ELMIRA AVE | 112 |
| 16TH ST | 108 |
| FRANKFORT AVE | 90 |
| I-40 | 80 |
| PARKWAY DR | 78 |
| I 40 | 76 |
| C ST | 74 |
| DETROIT AVE | 72 |
| GLENWOOD AVE | 70 |
| KNOXVILLE AVE | 70 |
| 12TH ST | 68 |
| WEIR RD | 68 |
| HWY 124 | 64 |
| ERIE AVE | 62 |
| J ST | 62 |
| O ST | 62 |
| STHY 124 | 60 |
| 2ND ST | 54 |
| BRADLEY COVE RD | 54 |
| 4TH ST | 52 |
| BERNICE AVE | 48 |
| GREENWICH AVE | 48 |
| L ST | 48 |
| PARKWAY AVE | 48 |
| SR 124 | 48 |
| 6TH ST | 46 |
| EL PASO AVE | 46 |
| Other | 1,274 |
2002 - 2018 National Fire Incident Reporting System (NFIRS) incidents
- Incident types reported to NFIRS in Russellville, AR
- 7,62344.0%Rescue & EMS
- 4,03223.3%Fire
- 1,6069.3%False Alarm
- 1,5238.8%Service Call
- 1,3597.8%Hazardous Condition
- 1,1366.6%Good Intent Call
- 250.1%Overpressure Rupture
- 190.1%Special Incident
- Fire incident types reported to NFIRS in Russellville, AR
- 1,84245.7%Outside Fires
- 1,51437.5%Structure Fires
- 57714.3%Mobile Property/Vehicle Fires
- 992.5%Other
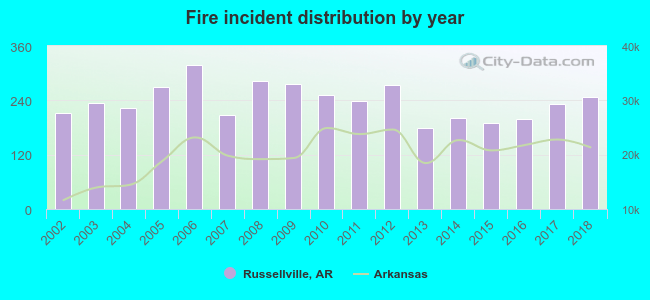 Based on the data from the years 2002 - 2018 the average number of fire incidents per year is 237. The highest number of reported fire incidents - 317 took place in 2006, and the least - 179 in 2013. The data has a rising trend.
The average number of yearly fire incidents per 10k residents in Russellville, AR compared to nearest cities:
(Note: Based on data for the last 3 years, including only cities with population 5,000 and above)
| Russellville: | 78.1 |
| Clarksville: | 120.3 |
| Morrilton: | 87.4 |
| Conway: | 51.4 |
| Greenbrier: | 210.4 |
| Hot Springs Village: | 27.8 |
| Maumelle: | 23.6 |
| Hot Springs: | 127.3 |
 The median response time based on all reported fire incidents is 5 minutes. This is lower than the Arkansas median value.
The median response time in Russellville, AR compared to nearest cities:
(Note: Based on data for all years, including only cities with at least 500 fire incidents)
| Russellville: | 5 minutes |
| Pottsville: | 9 minutes |
| Dover: | 10 minutes |
| Atkins: | 10 minutes |
| Clarksville: | 6 minutes |
| Morrilton: | 7 minutes |
| Perryville: | 8 minutes |
| Conway: | 5 minutes |
| Ozark: | 7 minutes |
 According to the reports from the years 2002 - 2018 the average number of fire-related yearly deaths is 0. The highest number of deaths - 2 took place in 2004, and the lowest - 0 in 2002. The data has a constant trend.
The average number of fatalities per 1,000 fires is 2. This indicator was the highest - 10 in 2007, and the lowest 0 in 2002. The trend for fatalities per 1,000 fires is constant. Compared to the state value the number of fatalities per 1,000 incidents is lower.
According to the reports from the years 2002 - 2018 the average number of fire-related yearly deaths is 0. The highest number of deaths - 2 took place in 2004, and the lowest - 0 in 2002. The data has a constant trend.
The average number of fatalities per 1,000 fires is 2. This indicator was the highest - 10 in 2007, and the lowest 0 in 2002. The trend for fatalities per 1,000 fires is constant. Compared to the state value the number of fatalities per 1,000 incidents is lower.Deaths per 1,000 incidents in Russellville, AR compared to nearest cities:
(Note: Based on data for all years, including only cities with at least 2,500 fire incidents)
| Russellville: | 1.7 |
| Conway: | 2.7 |
| Hot Springs: | 4.8 |
 According to the data from the years 2002 - 2018 the average number of fire-related casualties per year is 1. The highest number of reported casualties - 4 took place in 2005, and the lowest - 0 in 2002. The data has a constant trend.
The average number of casualties per 1,000 fire incidents is 4. This indicator was the highest - 15 in 2005, and the lowest 0 in 2002. The trend for casualties per 1,000 fire incidents is increasing. Compared to the state value the number of injuries per 1,000 fires is about the same.
According to the data from the years 2002 - 2018 the average number of fire-related casualties per year is 1. The highest number of reported casualties - 4 took place in 2005, and the lowest - 0 in 2002. The data has a constant trend.
The average number of casualties per 1,000 fire incidents is 4. This indicator was the highest - 15 in 2005, and the lowest 0 in 2002. The trend for casualties per 1,000 fire incidents is increasing. Compared to the state value the number of injuries per 1,000 fires is about the same.Casualties per 1,000 incidents in Russellville, AR compared to nearest cities:
(Note: Based on data for all years, including only cities with at least 500 fire incidents)
| Russellville: | 4.2 |
| Pottsville: | 0.0 |
| Dover: | 0.0 |
| Atkins: | 0.0 |
| Clarksville: | 1.6 |
| Morrilton: | 2.8 |
| Perryville: | 0.0 |
| Conway: | 0.6 |
| Ozark: | 1.6 |
 30.4% incidents where reported in the morning and 69.6% in the evening. The most fires (15.8%) took place on Saturday, and the least (12.8%) on Wednesday.
 Based on the 4,032 fire incidents from years 2002 - 2018 most fires (11.1%) took place during January, and the least (6.9%) in October.
 Out of all 17,338 cases reported during the years 2002 - 2018, the most belonged to the categories: Rescue & EMS (44.0%), Fire (23.3%), and False Alarm (9.3%).
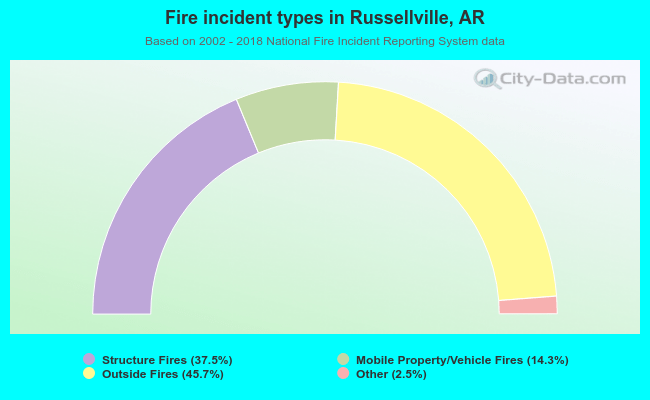 When looking into fire subcategories, the most reports belonged to: Outside Fires (45.7%), and Structure Fires (37.5%).