Romulus: Fire Incidents, Michigan (MI)
Where are fire incidents reported in Romulus, MI
Something went wrong! Please refresh the page.
| Fire incidents reported | |
|---|---|
| Sreet name | Count |
| MERRIMAN RD | 148 |
| MIDDLEBELT RD | 130 |
| ECORSE RD | 112 |
| I94 | 86 |
| MIDDLEBELT | 86 |
| INKSTER RD | 80 |
| WAYNE RD | 74 |
| HURON RIVER DR | 66 |
| HARRISON | 64 |
| NIAGARA | 64 |
| BEVERLY RD | 60 |
| ECORSE | 60 |
| EUREKA RD | 56 |
| EUREKA | 54 |
| NORTHLINE | 54 |
| GODDARD RD | 52 |
| WAYNE | 46 |
| WICK RD | 46 |
| HANNAN RD | 44 |
| DIANE DR | 42 |
| FLYNN DR | 42 |
| BEVERLY | 40 |
| BIBBINS | 40 |
| COGSWELL RD | 40 |
| VAN BORN | 40 |
| INKSTER | 36 |
| BRANDT | 34 |
| CORDELL | 34 |
| I275 | 34 |
| VAN BORN RD | 34 |
| Other | 248 |
2002 - 2018 National Fire Incident Reporting System (NFIRS) incidents
- Incident types reported to NFIRS in Romulus, MI
- 16,28762.2%Rescue & EMS
- 2,5859.9%Good Intent Call
- 2,3859.1%Hazardous Condition
- 2,0467.8%Fire
- 1,6226.2%Service Call
- 1,2044.6%False Alarm
- 440.2%Special Incident
- Fire incident types reported to NFIRS in Romulus, MI
- 74936.6%Structure Fires
- 72335.3%Outside Fires
- 52725.8%Mobile Property/Vehicle Fires
- 472.3%Other
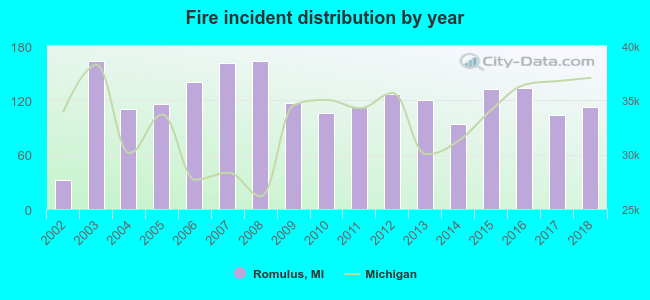 Based on the data from the years 2002 - 2018 the average number of fire incidents per year is 120. The highest number of fire incidents - 163 took place in 2003, and the least - 32 in 2002. The data has a rising trend.
The average number of yearly fire incidents per 10k residents in Romulus, MI compared to nearest cities:
(Note: Based on data for the last 3 years, including only cities with population 5,000 and above)
| Romulus: | 49.8 |
| Wayne: | 44.5 |
| Inkster: | 58.9 |
| Taylor: | 28.1 |
| Westland: | 25.0 |
| Garden City: | 29.7 |
| Dearborn Heights: | 21.7 |
| Canton: | 16.6 |
| Allen Park: | 25.0 |
 The median response time based on all reported fire incidents is 7 minutes. This is close to the state median value.
The median response time in Romulus, MI compared to nearest cities:
(Note: Based on data for all years, including only cities with at least 500 fire incidents)
| Romulus: | 7 minutes |
| Wayne: | 5 minutes |
| Inkster: | 5 minutes |
| Taylor: | 4 minutes |
| Westland: | 6 minutes |
| Belleville: | 7 minutes |
| Garden City: | 5 minutes |
| Dearborn Heights: | 6 minutes |
| Canton: | 6 minutes |
 According to the data from the years 2002 - 2018 the average number of fire-related fatalities per year is 0. The highest number of deaths - 2 took place in 2013, and the lowest - 0 in 2002. The data has a growing trend.
 According to the data from the years 2002 - 2018 the average number of fire-related yearly casualties is 2. The highest number of casualties - 5 took place in 2015, and the lowest - 0 in 2002. The data has a constant trend.
The average number of casualties per 1,000 fire incidents is 13. This indicator was the highest - 38 in 2015, and the lowest 0 in 2002. The trend for casualties per 1,000 fires is increasing. Compared to the Michigan value the number of casualties per 1,000 incidents is higher.
According to the data from the years 2002 - 2018 the average number of fire-related yearly casualties is 2. The highest number of casualties - 5 took place in 2015, and the lowest - 0 in 2002. The data has a constant trend.
The average number of casualties per 1,000 fire incidents is 13. This indicator was the highest - 38 in 2015, and the lowest 0 in 2002. The trend for casualties per 1,000 fires is increasing. Compared to the Michigan value the number of casualties per 1,000 incidents is higher.Casualties per 1,000 incidents in Romulus, MI compared to nearest cities:
(Note: Based on data for all years, including only cities with at least 500 fire incidents)
| Romulus: | 14.2 |
| Wayne: | 31.8 |
| Inkster: | 8.1 |
| Taylor: | 19.3 |
| Westland: | 14.1 |
| Belleville: | 8.6 |
| Garden City: | 29.5 |
| Dearborn Heights: | 21.4 |
| Canton: | 24.2 |
 33.1% incidents where reported in the morning and 66.9% in the evening. The most fires (16.1%) took place on Saturday, and the least (12.1%) on Wednesday.
 According to the 2,046 fire incident reports from years 2002 - 2018 most fires (12.9%) took place during July, and the least (4.8%) in December.
 Out of all 26,186 cases reported during the years 2002 - 2018, the most belonged to the categories: Rescue & EMS (62.2%), Good Intent Call (9.9%), and Hazardous Condition (9.1%).
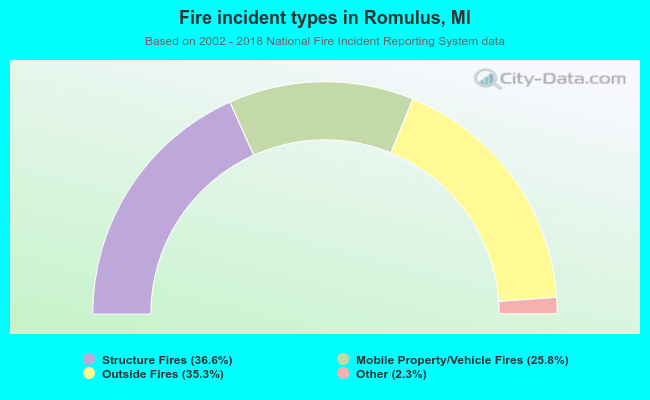 When looking into fire subcategories, the most incidents belonged to: Structure Fires (36.6%), and Outside Fires (35.3%).