Rio Rico: Fire Incidents, Arizona (AZ)
Where are fire incidents reported in Rio Rico, AZ
Something went wrong! Please refresh the page.
|
| |||||||||||||||||||||||||||||||||||||||||||||||||||||||||||||||||||||||||||||||||||||||||||||||||||||||||||||
2010 - 2018 National Fire Incident Reporting System (NFIRS) incidents
- Incident types reported to NFIRS in Rio Rico, AZ
- 1,64650.5%Rescue & EMS
- 96829.7%Service Call
- 2176.7%Good Intent Call
- 1665.1%Fire
- 1324.1%Hazardous Condition
- 1193.7%False Alarm
- 60.2%Special Incident
- 40.1%Overpressure Rupture
- Fire incident types reported to NFIRS in Rio Rico, AZ
- 7042.2%Outside Fires
- 4929.5%Structure Fires
- 2414.5%Mobile Property/Vehicle Fires
- 2313.9%Other
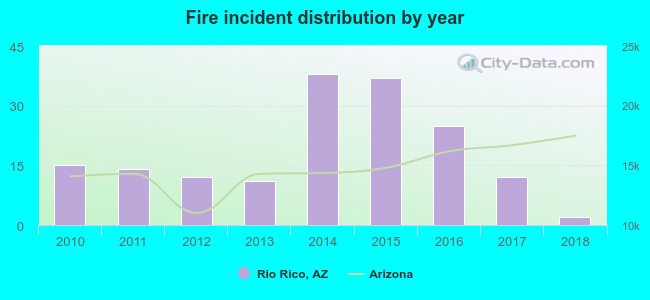 According to the data from the years 2010 - 2018 the average number of fire incidents per year is 18. The highest number of reported fires - 38 took place in 2014, and the least - 2 in 2018. The data has a decreasing trend.
The average number of yearly fire incidents per 10k residents in Rio Rico, AZ compared to nearest cities:
(Note: Based on data for the last 3 years, including only cities with population 5,000 and above)
| Rio Rico: | 6.9 |
| Nogales: | 16.0 |
| Green Valley: | 23.5 |
| Arivaca: | 2.6 |
| Sahuarita: | 10.8 |
| Corona de Tucson: | 2.6 |
| Vail: | 70.2 |
| Sierra Vista: | 15.5 |
| South Tucson: | 40.1 |

 25.9% incidents where reported in the morning and 74.1% in the evening. The most fires (18.1%) took place on Wednesday, and the least (9.0%) on Monday.
 According to the 166 reports from years 2010 - 2018 most fires (10.8%) took place during July, and the least (6.0%) in October.
 Out of all 3,259 cases reported during the years 2010 - 2018, the most belonged to the categories: Rescue & EMS (50.5%), Service Call (29.7%), and Good Intent Call (6.7%).
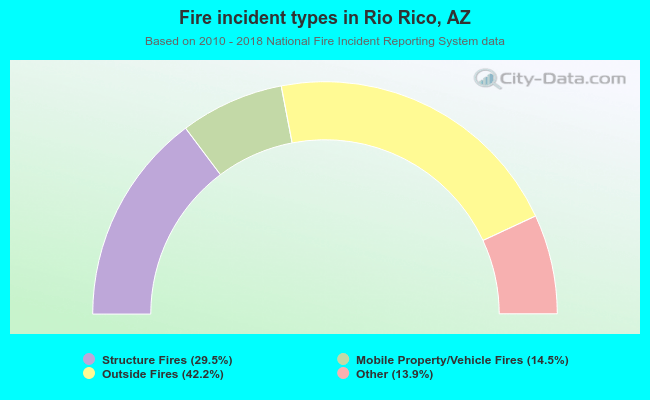 When looking into fire subcategories, the most reports belonged to: Outside Fires (42.2%), and Structure Fires (29.5%).