Richmond Heights: Fire Incidents, Missouri (MO)
Where are fire incidents reported in Richmond Heights, MO
Something went wrong! Please refresh the page.
| Fire incidents reported | |
|---|---|
| Sreet name | Count |
| ST LOUIS GALLERIA | 140 |
| CLAYTON RD | 136 |
| BELLEVUE AVE | 64 |
| I64 HWY | 62 |
| CLAYTON ROAD | 60 |
| BRENTWOOD BLVD | 44 |
| BIG BEND BLVD | 36 |
| DALE AVE | 36 |
| LACLEDE STATION RD | 32 |
| WISE AVE | 28 |
| DALE | 24 |
| WARNER AVE | 24 |
| HICKS AVE | 22 |
| LACLEDE STATION | 22 |
| BRENTWOOD BLVD | 20 |
| COLLINS AVE | 20 |
| EAGER RD | 20 |
| I-64 | 20 |
| I64 EB | 20 |
| ST ALBANS AVE | 20 |
| ST. LOUIS GALLERIA | 20 |
| BIG BEND BLVD | 18 |
| CLAYTON | 18 |
| WISE | 18 |
| HAWTHORNE PL | 16 |
| HIGHLAND TER | 16 |
| BERKSHIRE DR | 14 |
| ELINOR AVE | 14 |
| ETHEL AVE | 14 |
| HANLEY RD | 14 |
| Other | 22 |
2002 - 2018 National Fire Incident Reporting System (NFIRS) incidents
- Incident types reported to NFIRS in Richmond Heights, MO
- 6,91351.9%Rescue & EMS
- 1,88614.2%False Alarm
- 1,81413.6%Hazardous Condition
- 1,40710.6%Good Intent Call
- 1,0347.8%Fire
- 2101.6%Service Call
- 410.3%Overpressure Rupture
- 160.1%Special Incident
- Fire incident types reported to NFIRS in Richmond Heights, MO
- 50448.7%Structure Fires
- 18417.8%Mobile Property/Vehicle Fires
- 18317.7%Outside Fires
- 16315.8%Other
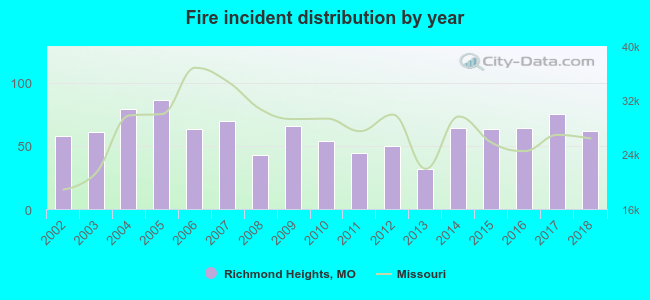 According to the data from the years 2002 - 2018 the average number of fire incidents per year is 61. The highest number of reported fires - 86 took place in 2005, and the least - 32 in 2013. The data has an increasing trend.
The average number of yearly fire incidents per 10k residents in Richmond Heights, MO compared to nearest cities:
(Note: Based on data for the last 3 years, including only cities with population 5,000 and above)
| Richmond Heights: | 78.9 |
| Maplewood: | 75.0 |
| Clayton: | 43.4 |
| Brentwood: | 51.4 |
| University City: | 47.4 |
| Shrewsbury: | 28.5 |
| Ladue: | 48.2 |
| Webster Groves: | 24.9 |
| Glendale: | 11.3 |
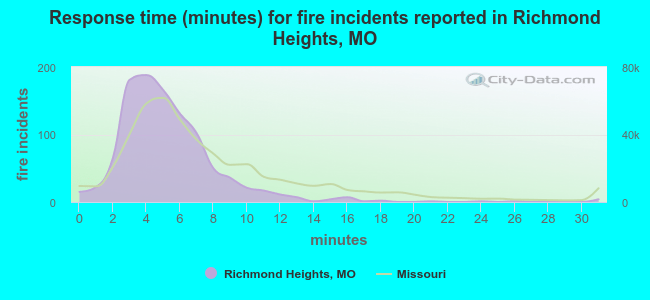 The median response time based on all reported fire incidents is 5 minutes. This is lower than the Missouri median value.
The median response time in Richmond Heights, MO compared to nearest cities:
(Note: Based on data for all years, including only cities with at least 500 fire incidents)
| Richmond Heights: | 5 minutes |
| Maplewood: | 4 minutes |
| Clayton: | 4 minutes |
| Brentwood: | 4 minutes |
| University City: | 5 minutes |
| Shrewsbury: | 5 minutes |
| Ladue: | 6 minutes |
| Webster Groves: | 5 minutes |
| Olivette: | 5 minutes |
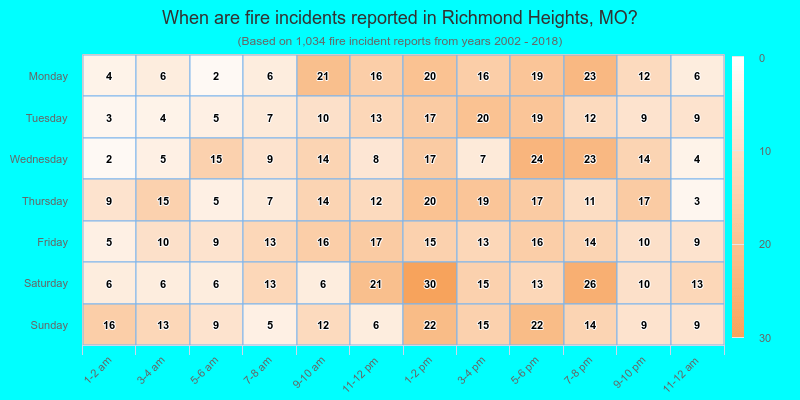
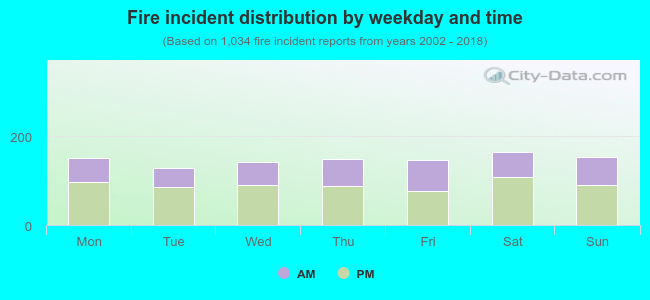 38.8% incidents where reported in the morning and 61.2% in the evening. The most fires (16.0%) took place on Saturday, and the least (12.4%) on Tuesday.
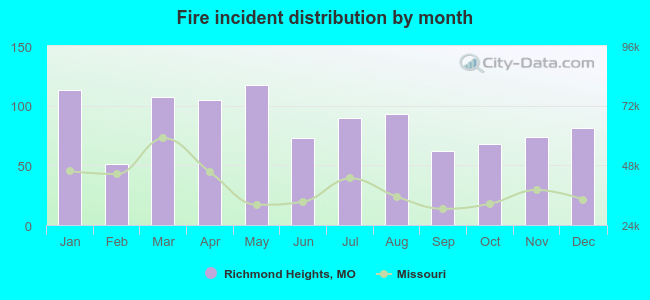 Based on the 1,034 incident reports from years 2002 - 2018 most fires (11.3%) took place during May, and the least (4.9%) in February.
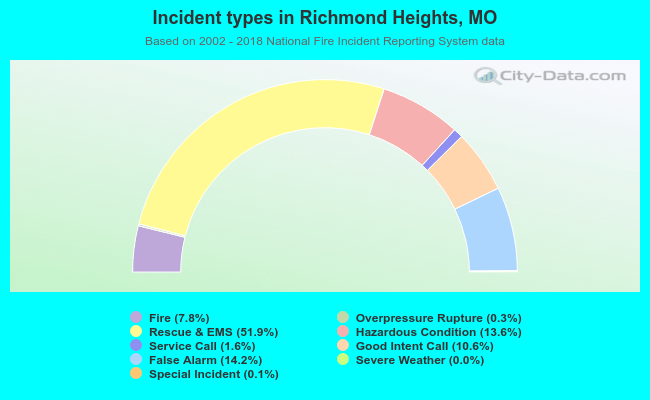 Out of all 13,326 cases reported during the years 2002 - 2018, the most belonged to the categories: Rescue & EMS (51.9%), False Alarm (14.2%), and Hazardous Condition (13.6%).
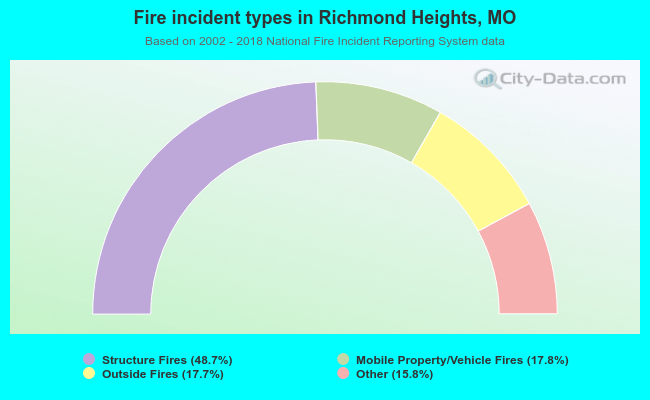 When looking into fire subcategories, the most reports belonged to: Structure Fires (48.7%), and Mobile Property/Vehicle Fires (17.8%).