Pullman: Fire Incidents, Washington (WA)
Where are fire incidents reported in Pullman, WA
Something went wrong! Please refresh the page.
| Fire incidents reported | |
|---|---|
| Sreet name | Count |
| MERMAN DR | 130 |
| GRAND AVE | 126 |
| TERRE VIEW DR | 120 |
| MAPLE ST | 72 |
| KAMIAKEN ST | 54 |
| CAMPUS ST | 46 |
| OAK ST | 46 |
| COLORADO ST | 44 |
| VALLEY RD | 44 |
| B ST | 40 |
| BRANDI WAY | 36 |
| FISK ST | 36 |
| BISHOP BLVD | 34 |
| KLEMGARD AVE | 34 |
| C ST | 32 |
| HILLSIDE DR | 32 |
| LARRY ST | 32 |
| STADIUM WAY | 32 |
| MAIDEN LANE | 30 |
| MAIN ST | 30 |
| WHEATLAND DR | 30 |
| STATE ST | 26 |
| MORTON ST | 24 |
| OPAL ST | 24 |
| CALIFORNIA ST | 22 |
| WESTWOOD DR | 22 |
| INDIANA ST | 20 |
| CRESTVIEW ST | 18 |
| DEANE DR | 18 |
| LINDEN ST | 18 |
2002 - 2018 National Fire Incident Reporting System (NFIRS) incidents
- Incident types reported to NFIRS in Pullman, WA
- 6,67659.8%Rescue & EMS
- 1,53213.7%False Alarm
- 1,26011.3%Fire
- 7616.8%Hazardous Condition
- 5845.2%Good Intent Call
- 3343.0%Service Call
- Fire incident types reported to NFIRS in Pullman, WA
- 56344.7%Structure Fires
- 55043.7%Outside Fires
- 836.6%Mobile Property/Vehicle Fires
- 645.1%Other
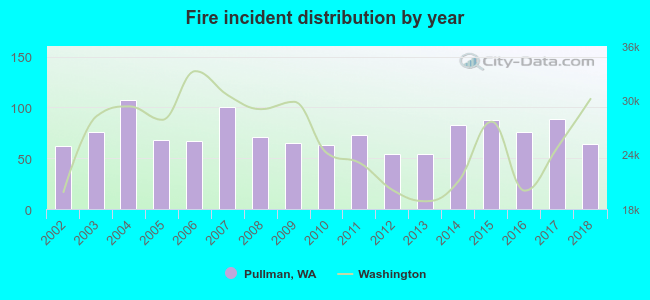 Based on the data from the years 2002 - 2018 the average number of fires per year is 74. The highest number of fire incidents - 107 took place in 2004, and the least - 54 in 2012. The data has a growing trend.
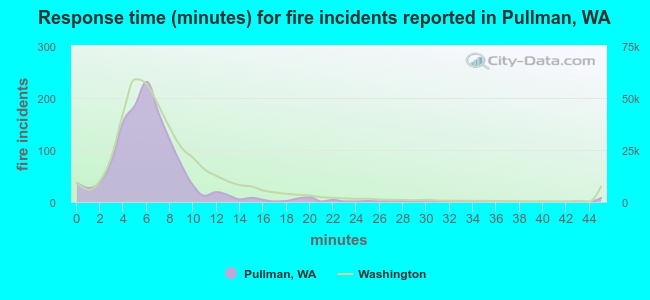 The median response time based on all reported fire incidents is 6 minutes. This is similar to the Washington median value.
The median response time in Pullman, WA compared to nearest cities:
(Note: Based on data for all years, including only cities with at least 500 fire incidents)
| Pullman: | 6 minutes |
| Moscow: | 5 minutes |
| Clarkston: | 4 minutes |
| Lewiston: | 4 minutes |
| Cheney: | 6 minutes |
| Medical Lake: | 12 minutes |
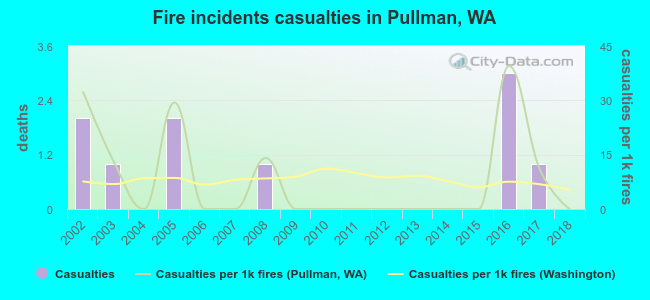 According to the reports from the years 2002 - 2018 the average number of fire-related casualties per year is 1. The highest number of injuries - 3 took place in 2016, and the lowest - 0 in 2004. The data has a declining trend.
The average number of injuries per 1,000 fires is 8. This indicator was the highest - 39 in 2016, and the lowest 0 in 2004. The trend for injuries per 1,000 fire incidents is dropping. Compared to the Washington value the number of casualties per 1,000 fire incidents is similar.
According to the reports from the years 2002 - 2018 the average number of fire-related casualties per year is 1. The highest number of injuries - 3 took place in 2016, and the lowest - 0 in 2004. The data has a declining trend.
The average number of injuries per 1,000 fires is 8. This indicator was the highest - 39 in 2016, and the lowest 0 in 2004. The trend for injuries per 1,000 fire incidents is dropping. Compared to the Washington value the number of casualties per 1,000 fire incidents is similar.Casualties per 1,000 incidents in Pullman, WA compared to nearest cities:
(Note: Based on data for all years, including only cities with at least 500 fire incidents)
| Pullman: | 7.9 |
| Moscow: | 4.2 |
| Clarkston: | 3.0 |
| Lewiston: | 17.4 |
| Cheney: | 10.0 |
| Medical Lake: | 2.5 |
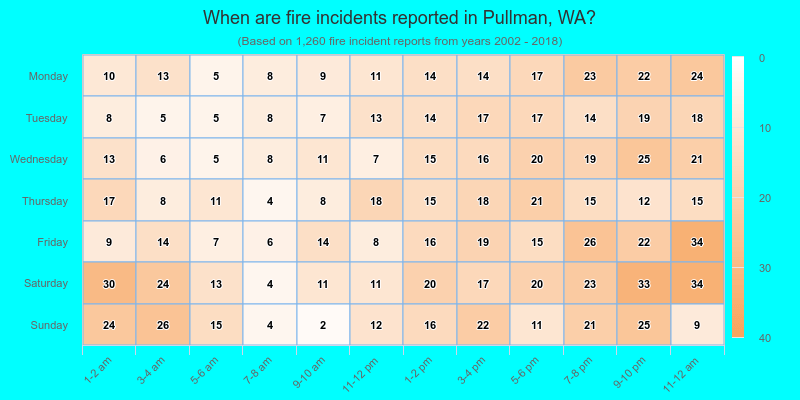
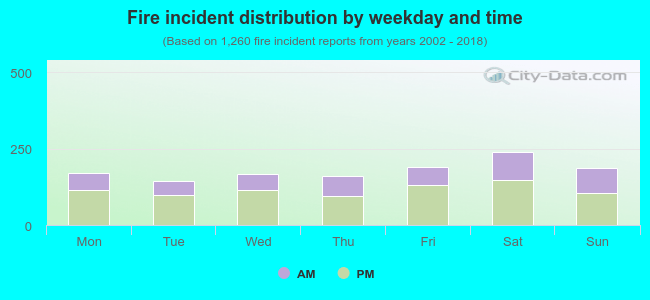 35.9% incidents where reported in the morning and 64.1% in the evening. The most fires (19.0%) took place on Saturday, and the least (11.5%) on Tuesday.
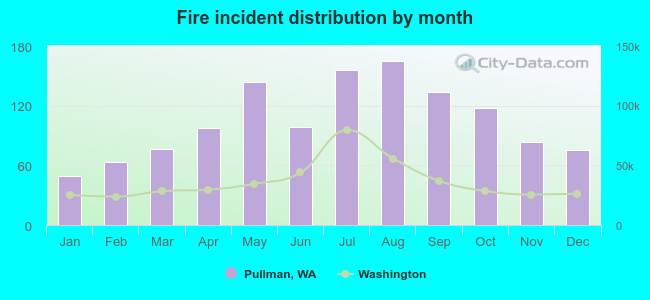 Based on the 1,260 incident reports from years 2002 - 2018 most fires (13.1%) took place during August, and the least (3.9%) in January.
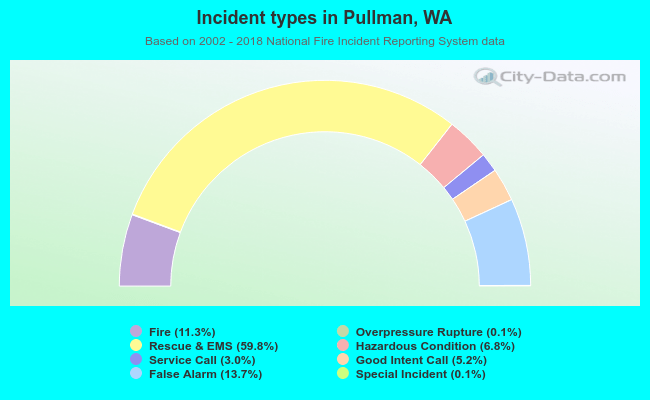 Out of all 11,164 cases reported during the years 2002 - 2018, the most belonged to the categories: Rescue & EMS (59.8%), False Alarm (13.7%), and Fire (11.3%).
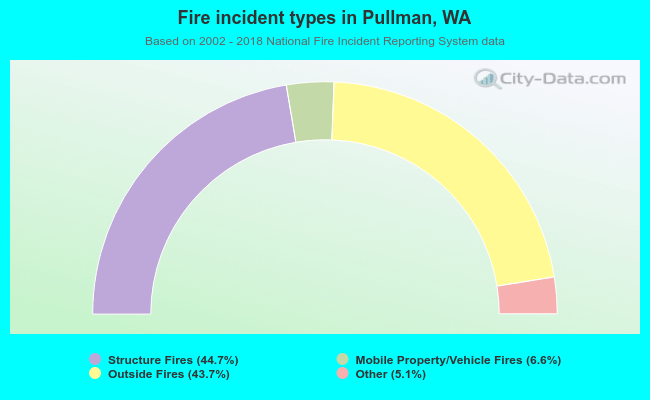 When looking into fire subcategories, the most reports belonged to: Structure Fires (44.7%), and Outside Fires (43.7%).