Portales: Fire Incidents, New Mexico (NM)
Where are fire incidents reported in Portales, NM
Something went wrong! Please refresh the page.
|
| |||||||||||||||||||||||||||||||||||||||||||||||||||||||||||||||||||||||||||||||||||||||||||||||||||||||||||||
| Other | 820 | |||||||||||||||||||||||||||||||||||||||||||||||||||||||||||||||||||||||||||||||||||||||||||||||||||||||||||||
2002 - 2018 National Fire Incident Reporting System (NFIRS) incidents
- Incident types reported to NFIRS in Portales, NM
- 1,39853.9%Fire
- 36914.2%Hazardous Condition
- 30611.8%Good Intent Call
- 26710.3%False Alarm
- 1325.1%Rescue & EMS
- 923.5%Service Call
- 190.7%Overpressure Rupture
- 90.3%Special Incident
- Fire incident types reported to NFIRS in Portales, NM
- 90064.4%Outside Fires
- 22716.2%Structure Fires
- 15811.3%Other
- 1138.1%Mobile Property/Vehicle Fires
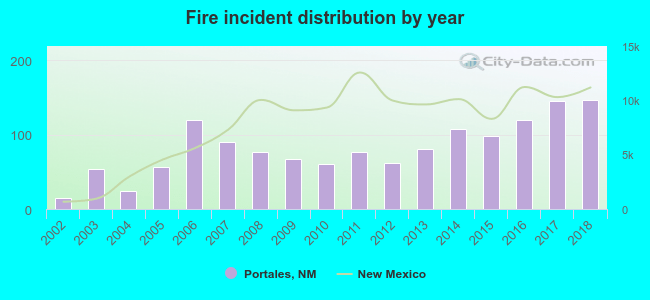 According to the data from the years 2002 - 2018 the average number of fire incidents per year is 82. The highest number of reported fire incidents - 146 took place in 2018, and the least - 15 in 2002. The data has a growing trend.
 The median response time based on all reported fire incidents is 7 minutes. This is close to the New Mexico median value.
 Based on the reports from the years 2002 - 2018 the average number of fire-related yearly deaths is 0. The highest number of reported deaths - 2 took place in 2016, and the lowest - 0 in 2002. The data has a constant trend.
 29.1% incidents where reported in the morning and 70.9% in the evening. The most fires (14.9%) took place on Monday, and the least (13.9%) on Tuesday.
 According to the 1,398 fire incidents from years 2002 - 2018 most fires (11.2%) took place during March, and the least (6.0%) in September.
 Out of all 2,593 cases reported during the years 2002 - 2018, the most belonged to the categories: Fire (53.9%), Hazardous Condition (14.2%), and Good Intent Call (11.8%).
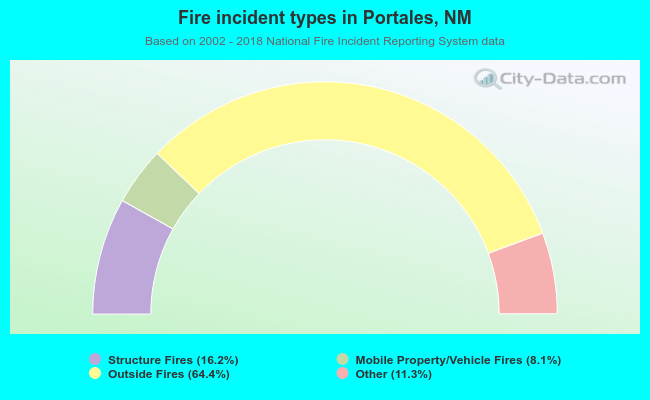 When looking into fire subcategories, the most incidents belonged to: Outside Fires (64.4%), and Structure Fires (16.2%).