Port St. Lucie: Fire Incidents, Florida (FL)
Where are fire incidents reported in Port St. Lucie, FL
Something went wrong! Please refresh the page.
|
| |||||||||||||||||||||||||||||||||||||||||||||||||||||||||||||||||||||||||||||||||||||||||||||||||||||||||||||
| Other | 185 | |||||||||||||||||||||||||||||||||||||||||||||||||||||||||||||||||||||||||||||||||||||||||||||||||||||||||||||
2002 - 2004 National Fire Incident Reporting System (NFIRS) incidents
- Incident types reported to NFIRS in Port St. Lucie, FL
- 67236.2%False Alarm
- 48726.2%Fire
- 36219.5%Good Intent Call
- 25813.9%Hazardous Condition
- 492.6%Service Call
- 170.9%Special Incident
- 50.3%Overpressure Rupture
- 40.2%Rescue & EMS
- 40.2%Severe Weather
- Fire incident types reported to NFIRS in Port St. Lucie, FL
- 28458.3%Outside Fires
- 11223.0%Structure Fires
- 8918.3%Mobile Property/Vehicle Fires
- 20.4%Other
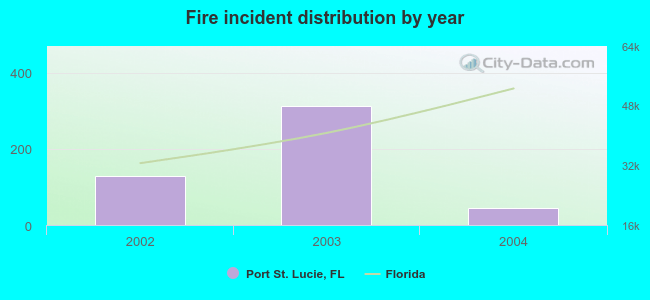 According to the data from the years 2002 - 2004 the average number of fire incidents per year is 162. The highest number of fire incidents - 314 took place in 2003, and the least - 45 in 2004. The data has a dropping trend.
 26.1% incidents where reported in the morning and 73.9% in the evening. The most fires (16.0%) took place on Wednesday, and the least (10.5%) on Thursday.
 According to the 487 incident reports from years 2002 - 2004 most fires (9.9%) took place during June, and the least (4.9%) in November.
 Out of all 1,858 cases reported during the years 2002 - 2004, the most belonged to the categories: False Alarm (36.2%), Fire (26.2%), and Good Intent Call (19.5%).
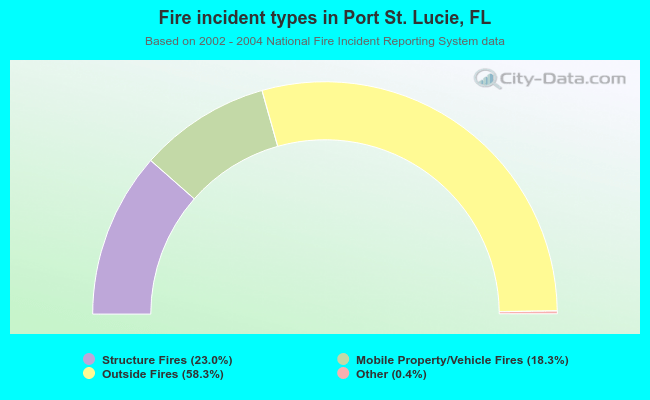 When looking into fire subcategories, the most reports belonged to: Outside Fires (58.3%), and Structure Fires (23.0%).