Port Angeles: Fire Incidents, Washington (WA)
Where are fire incidents reported in Port Angeles, WA
Something went wrong! Please refresh the page.
| Fire incidents reported | |
|---|---|
| Sreet name | Count |
| HIGHWAY 101 | 226 |
| MARINE DR | 134 |
| HWY 101 | 122 |
| 1ST ST | 118 |
| LAURIDSEN BLVD | 118 |
| DEER PARK RD | 94 |
| EDGEWOOD DR | 86 |
| BLACK DIAMOND RD | 72 |
| FRONT ST | 72 |
| 6TH ST | 70 |
| 5TH ST | 68 |
| 8TH ST | 68 |
| MOUNT PLEASANT RD | 62 |
| 18TH ST | 60 |
| EDIZ HOOK RD | 60 |
| 3RD ST | 58 |
| 10TH ST | 54 |
| 4TH ST | 54 |
| LOWER ELWHA RD | 54 |
| 11TH ST | 52 |
| 16TH ST | 52 |
| HWY 112 | 52 |
| 12TH ST | 46 |
| 7TH ST | 46 |
| LINCOLN ST | 46 |
| BENSON RD | 44 |
| 9TH ST | 42 |
| COTTONWOOD LN | 42 |
| 14TH ST | 40 |
| 15TH ST | 40 |
| Other | 604 |
2002 - 2018 National Fire Incident Reporting System (NFIRS) incidents
- Incident types reported to NFIRS in Port Angeles, WA
- 20,40769.1%Rescue & EMS
- 2,7569.3%Fire
- 2,4478.3%Service Call
- 1,8286.2%Good Intent Call
- 1,1113.8%False Alarm
- 8202.8%Hazardous Condition
- 1280.4%Special Incident
- Fire incident types reported to NFIRS in Port Angeles, WA
- 1,06438.6%Outside Fires
- 98935.9%Structure Fires
- 37913.8%Mobile Property/Vehicle Fires
- 32411.8%Other
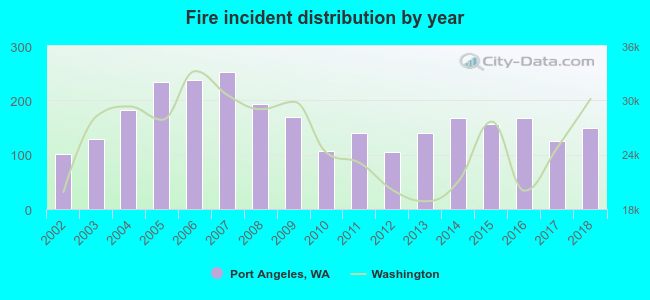 Based on the data from the years 2002 - 2018 the average number of fires per year is 162. The highest number of fires - 253 took place in 2007, and the least - 101 in 2002. The data has a growing trend.
The average number of yearly fire incidents per 10k residents in Port Angeles, WA compared to nearest cities:
(Note: Based on data for the last 3 years, including only cities with population 5,000 and above)
| Port Angeles: | 76.7 |
| Sequim: | 48.5 |
| Discovery Bay: | 2.2 |
| Port Townsend: | 94.4 |
| Oak Harbor: | 43.0 |
| Poulsbo: | 74.6 |
| Anacortes: | 66.5 |
| Silverdale: | 41.8 |
| Tahuya: | 32.4 |
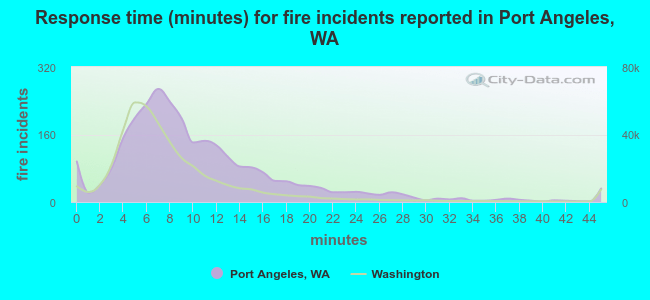 The median response time based on all reported fire incidents is 9 minutes. This is higher compared to the Washington median value.
The median response time in Port Angeles, WA compared to nearest cities:
(Note: Based on data for all years, including only cities with at least 500 fire incidents)
| Port Angeles: | 9 minutes |
| Sequim: | 7 minutes |
| Port Townsend: | 7 minutes |
| Quilcene: | 13 minutes |
| Oak Harbor: | 5 minutes |
| Poulsbo: | 8 minutes |
| Anacortes: | 7 minutes |
| Silverdale: | 7 minutes |
| Hoodsport: | 14 minutes |
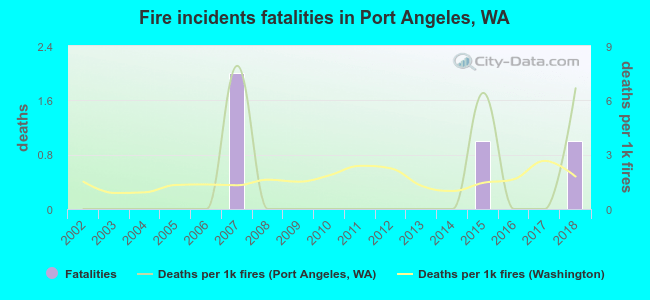 Based on the data from the years 2002 - 2018 the average number of fire-related fatalities per year is 0. The highest number of reported deaths - 2 took place in 2007, and the lowest - 0 in 2002. The data has an increasing trend.
The average number of deaths per 1,000 fires is 1. This indicator was the highest - 8 in 2007, and the lowest 0 in 2002. The trend for deaths per 1,000 incidents is rising. Compared to the state value the number of fatalities per 1,000 fires is about the same.
Based on the data from the years 2002 - 2018 the average number of fire-related fatalities per year is 0. The highest number of reported deaths - 2 took place in 2007, and the lowest - 0 in 2002. The data has an increasing trend.
The average number of deaths per 1,000 fires is 1. This indicator was the highest - 8 in 2007, and the lowest 0 in 2002. The trend for deaths per 1,000 incidents is rising. Compared to the state value the number of fatalities per 1,000 fires is about the same.Deaths per 1,000 incidents in Port Angeles, WA compared to nearest cities:
(Note: Based on data for all years, including only cities with at least 2,500 fire incidents)
| Port Angeles: | 1.5 |
| Bremerton: | 3.3 |
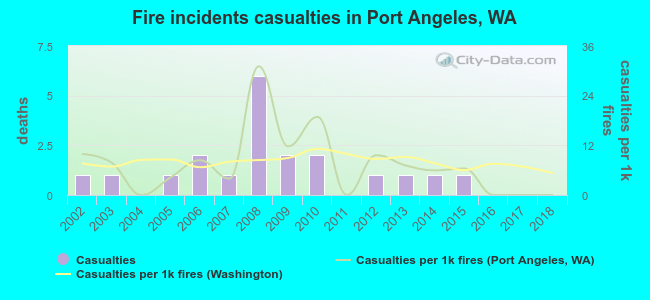 According to the reports from the years 2002 - 2018 the average number of fire-related casualties per year is 1. The highest number of casualties - 6 took place in 2008, and the lowest - 0 in 2004. The data has a declining trend.
The average number of casualties per 1,000 fire incidents is 7. This indicator was the highest - 31 in 2008, and the lowest 0 in 2004. The trend for casualties per 1,000 fires is decreasing. Compared to the state value the number of injuries per 1,000 fires is about the same.
According to the reports from the years 2002 - 2018 the average number of fire-related casualties per year is 1. The highest number of casualties - 6 took place in 2008, and the lowest - 0 in 2004. The data has a declining trend.
The average number of casualties per 1,000 fire incidents is 7. This indicator was the highest - 31 in 2008, and the lowest 0 in 2004. The trend for casualties per 1,000 fires is decreasing. Compared to the state value the number of injuries per 1,000 fires is about the same.Casualties per 1,000 incidents in Port Angeles, WA compared to nearest cities:
(Note: Based on data for all years, including only cities with at least 500 fire incidents)
| Port Angeles: | 7.3 |
| Sequim: | 1.1 |
| Port Townsend: | 5.3 |
| Quilcene: | 0.0 |
| Oak Harbor: | 9.9 |
| Poulsbo: | 6.0 |
| Anacortes: | 6.2 |
| Silverdale: | 14.6 |
| Hoodsport: | 0.0 |
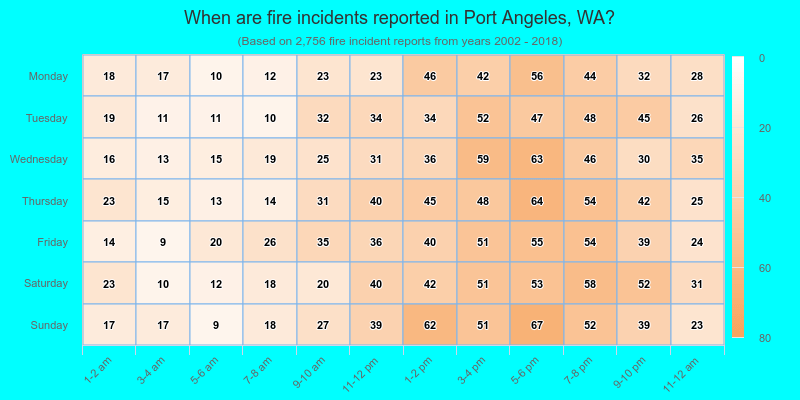
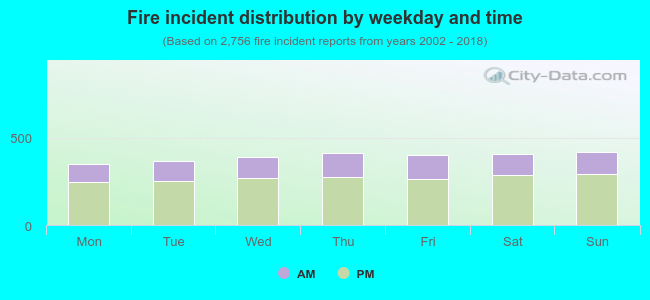 31.4% incidents where reported in the morning and 68.6% in the evening. The most fires (15.3%) took place on Sunday, and the least (12.7%) on Monday.
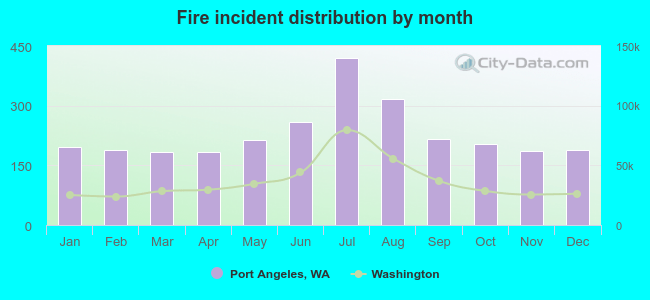 According to the 2,756 reports from years 2002 - 2018 most fires (15.2%) took place during July, and the least (6.6%) in March.
 Out of all 29,529 cases reported during the years 2002 - 2018, the most belonged to the categories: Rescue & EMS (69.1%), Fire (9.3%), and Service Call (8.3%).
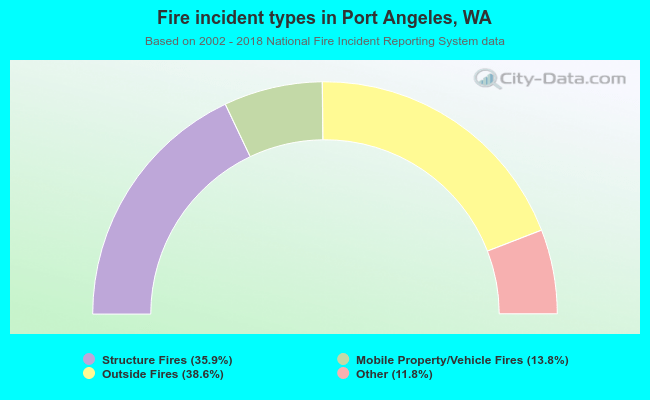 When looking into fire subcategories, the most reports belonged to: Outside Fires (38.6%), and Structure Fires (35.9%).