Ponca City: Fire Incidents, Oklahoma (OK)
Where are fire incidents reported in Ponca City, OK
Something went wrong! Please refresh the page.
| Fire incidents reported | |
|---|---|
| Sreet name | Count |
| 14TH ST | 202 |
| PROSPECT AVE | 168 |
| UNION ST | 162 |
| 5TH ST | 122 |
| WAVERLY ST | 120 |
| LAKE ROAD | 112 |
| OAK ST | 108 |
| 7TH ST | 96 |
| HIGHLAND AVE | 96 |
| SOUTH AVE | 94 |
| GRAND AVE | 88 |
| ASH ST | 86 |
| HARTFORD AVE | 86 |
| ELM ST | 80 |
| OSAGE ST | 78 |
| 9TH ST | 74 |
| HUBBARD RD | 66 |
| PALM ST | 64 |
| PINE ST | 58 |
| 1ST ST | 56 |
| 6TH ST | 56 |
| LIBERTY AVE | 56 |
| PECAN RD | 56 |
| 4TH ST | 54 |
| ENTERPRISE RD | 50 |
| BIRCH ST | 48 |
| 8TH ST | 44 |
| LAKE RD | 44 |
| PEACHTREE ST | 40 |
| OAKLAND AVE | 38 |
| Other | 531 |
2003 - 2018 National Fire Incident Reporting System (NFIRS) incidents
- Incident types reported to NFIRS in Ponca City, OK
- 6,45848.3%Rescue & EMS
- 3,03322.7%Fire
- 1,94514.6%Service Call
- 7745.8%Hazardous Condition
- 7425.6%False Alarm
- 3522.6%Good Intent Call
- 330.2%Overpressure Rupture
- 210.2%Special Incident
- Fire incident types reported to NFIRS in Ponca City, OK
- 1,76758.3%Outside Fires
- 59719.7%Structure Fires
- 35111.6%Other
- 31810.5%Mobile Property/Vehicle Fires
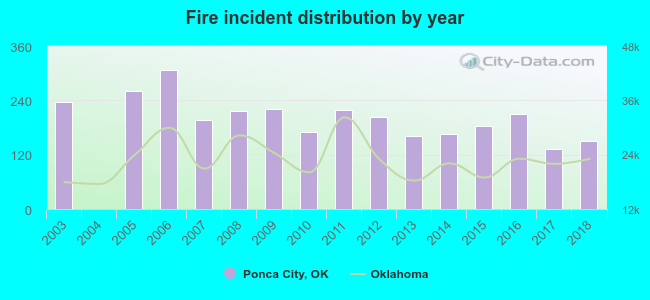 According to the data from the years 2003 - 2018 the average number of fire incidents per year is 190. The highest number of reported fire incidents - 306 took place in 2006, and the least - 0 in 2004. The data has a decreasing trend.
The average number of yearly fire incidents per 10k residents in Ponca City, OK compared to nearest cities:
(Note: Based on data for the last 3 years, including only cities with population 5,000 and above)
| Ponca City: | 66.2 |
| Blackwell: | 103.6 |
| Perry: | 113.0 |
| Stillwater: | 18.3 |
 The median response time based on all reported fire incidents is 5 minutes. This is lower compared to the state median value.
The median response time in Ponca City, OK compared to nearest cities:
(Note: Based on data for all years, including only cities with at least 500 fire incidents)
| Ponca City: | 5 minutes |
| Tonkawa: | 5 minutes |
| Blackwell: | 5 minutes |
| Arkansas City: | 7 minutes |
| Perry: | 8 minutes |
| Winfield: | 8 minutes |
| Stillwater: | 8 minutes |
| Pawhuska: | 5 minutes |
| Wellington: | 7 minutes |
 Based on the reports from the years 2003 - 2018 the average number of fire-related fatalities per year is 0. The highest number of deaths - 1 took place in 2003, and the lowest - 0 in 2004. The data has a dropping trend.
The average number of fatalities per 1,000 fires is 1. This indicator was the highest - 6 in 2014, and the lowest 0 in 2004. The trend for fatalities per 1,000 fire incidents is decreasing. Compared to the Oklahoma value the number of deaths per 1,000 incidents is about the same.
Based on the reports from the years 2003 - 2018 the average number of fire-related fatalities per year is 0. The highest number of deaths - 1 took place in 2003, and the lowest - 0 in 2004. The data has a dropping trend.
The average number of fatalities per 1,000 fires is 1. This indicator was the highest - 6 in 2014, and the lowest 0 in 2004. The trend for fatalities per 1,000 fire incidents is decreasing. Compared to the Oklahoma value the number of deaths per 1,000 incidents is about the same.Deaths per 1,000 incidents in Ponca City, OK compared to nearest cities:
(Note: Based on data for all years, including only cities with at least 2,500 fire incidents)
| Ponca City: | 1.6 |
 Based on the data from the years 2003 - 2018 the average number of fire-related casualties per year is 1. The highest number of injuries - 6 took place in 2018, and the lowest - 0 in 2004. The data has an increasing trend.
The average number of casualties per 1,000 fire incidents is 4. This indicator was the highest - 40 in 2018, and the lowest 0 in 2004. The trend for injuries per 1,000 incidents is rising. Compared to the state value the number of injuries per 1,000 fires is similar.
Based on the data from the years 2003 - 2018 the average number of fire-related casualties per year is 1. The highest number of injuries - 6 took place in 2018, and the lowest - 0 in 2004. The data has an increasing trend.
The average number of casualties per 1,000 fire incidents is 4. This indicator was the highest - 40 in 2018, and the lowest 0 in 2004. The trend for injuries per 1,000 incidents is rising. Compared to the state value the number of injuries per 1,000 fires is similar.Casualties per 1,000 incidents in Ponca City, OK compared to nearest cities:
(Note: Based on data for all years, including only cities with at least 500 fire incidents)
| Ponca City: | 4.3 |
| Tonkawa: | 3.4 |
| Blackwell: | 0.0 |
| Arkansas City: | 7.8 |
| Perry: | 3.5 |
| Winfield: | 7.0 |
| Stillwater: | 0.0 |
| Pawhuska: | 1.2 |
| Wellington: | 4.8 |
 26.9% incidents where reported in the morning and 73.1% in the evening. The most fires (15.4%) took place on Friday, and the least (13.1%) on Tuesday.
 According to the 3,033 fire incident reports from years 2003 - 2018 most fires (14.4%) took place during March, and the least (5.3%) in May.
 Out of all 13,361 cases reported during the years 2003 - 2018, the most belonged to the categories: Rescue & EMS (48.3%), Fire (22.7%), and Service Call (14.6%).
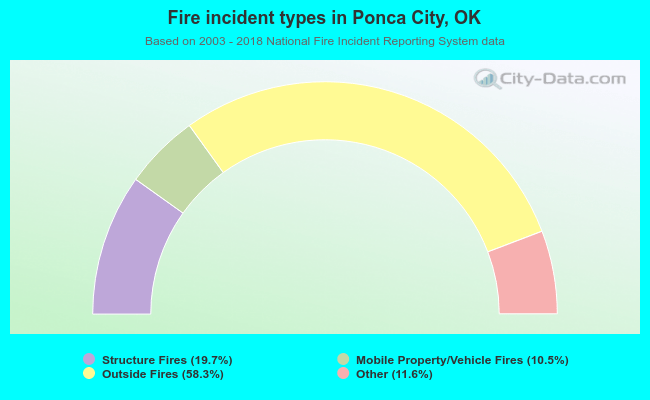 When looking into fire subcategories, the most incidents belonged to: Outside Fires (58.3%), and Structure Fires (19.7%).