Pocahontas: Fire Incidents, Arkansas (AR)
Where are fire incidents reported in Pocahontas, AR
Something went wrong! Please refresh the page.
|
| |||||||||||||||||||||||||||||||||||||||||||||||||||||||||||||||||||||||||||||||||||||||||||||||||||||||||||||
| Other | 219 | |||||||||||||||||||||||||||||||||||||||||||||||||||||||||||||||||||||||||||||||||||||||||||||||||||||||||||||
2002 - 2018 National Fire Incident Reporting System (NFIRS) incidents
- Incident types reported to NFIRS in Pocahontas, AR
- 1,70954.5%Fire
- 46014.7%Hazardous Condition
- 35211.2%Rescue & EMS
- 34411.0%Good Intent Call
- 1554.9%False Alarm
- 922.9%Service Call
- 110.4%Severe Weather
- 60.2%Special Incident
- 40.1%Overpressure Rupture
- Fire incident types reported to NFIRS in Pocahontas, AR
- 91453.5%Outside Fires
- 52630.8%Structure Fires
- 21512.6%Mobile Property/Vehicle Fires
- 543.2%Other
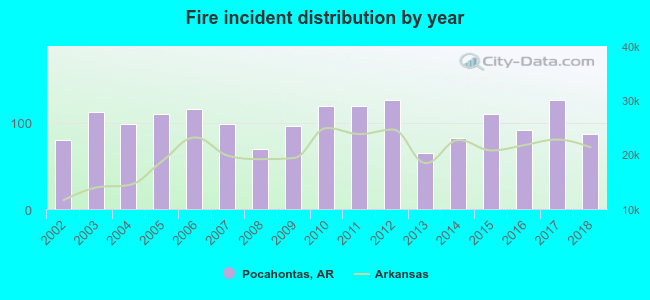 Based on the data from the years 2002 - 2018 the average number of fires per year is 101. The highest number of reported fire incidents - 126 took place in 2012, and the least - 65 in 2013. The data has an increasing trend.
 The median response time based on all reported fire incidents is 5 minutes. This is lower than the state median value.
The median response time in Pocahontas, AR compared to nearest cities:
(Note: Based on data for all years, including only cities with at least 500 fire incidents)
| Pocahontas: | 5 minutes |
| Walnut Ridge: | 4 minutes |
| Hoxie: | 6 minutes |
| Bono: | 8 minutes |
| Hardy: | 10 minutes |
| Paragould: | 4 minutes |
| Cherokee Village: | 5 minutes |
| Jonesboro: | 5 minutes |
| Ash Flat: | 6 minutes |
 According to the data from the years 2002 - 2018 the average number of fire-related yearly deaths is 0. The highest number of deaths - 2 took place in 2004, and the lowest - 0 in 2002. The data has a constant trend.
 27.4% incidents where reported in the morning and 72.6% in the evening. The most fires (17.1%) took place on Saturday, and the least (12.7%) on Thursday.
 According to the 1,709 incident reports from years 2002 - 2018 most fires (15.4%) took place during March, and the least (5.3%) in August.
 Out of all 3,133 cases reported during the years 2002 - 2018, the most belonged to the categories: Fire (54.5%), Hazardous Condition (14.7%), and Rescue & EMS (11.2%).
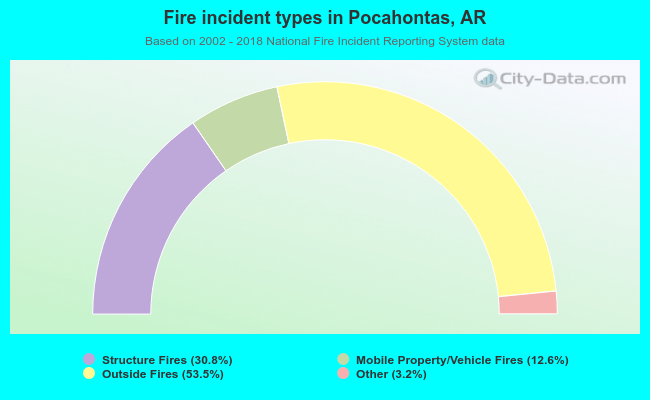 When looking into fire subcategories, the most incidents belonged to: Outside Fires (53.5%), and Structure Fires (30.8%).