Philadelphia: Fire Incidents, Mississippi (MS)
Where are fire incidents reported in Philadelphia, MS
Something went wrong! Please refresh the page.
| Fire incidents reported | |
|---|---|
| Sreet name | Count |
| HIGHWAY 21 | 188 |
| HIGHWAY 19 | 124 |
| HIGHWAY 16 | 122 |
| ROAD 505 | 110 |
| HIGHWAY 15 | 108 |
| ROAD 832 | 78 |
| HIGHWAY 486 | 68 |
| LEWIS AVE | 66 |
| ROAD 610 | 60 |
| 19 HWY | 58 |
| BEACON ST | 58 |
| ROAD 602 | 48 |
| HIGHWAY 482 | 46 |
| HWY 488 | 46 |
| PECAN AVE | 46 |
| ROAD 573 | 46 |
| ROAD 404 | 44 |
| HWY 21 | 42 |
| HIGHWAY 488 | 40 |
| MAIN ST | 38 |
| GUM ST | 36 |
| HWY 482 | 36 |
| ROAD 212 | 36 |
| HIGHWAY 491 | 34 |
| HOLLAND AVE | 34 |
| HWY 19 | 32 |
| 17048 HWY 21 S | 30 |
| 383 RD | 30 |
| ROAD 842 | 30 |
| 16 HWY | 28 |
| Other | 1,750 |
2002 - 2018 National Fire Incident Reporting System (NFIRS) incidents
- Incident types reported to NFIRS in Philadelphia, MS
- 5,54146.1%Rescue & EMS
- 3,51229.2%Fire
- 1,60013.3%Hazardous Condition
- 4964.1%Service Call
- 4333.6%Good Intent Call
- 3853.2%False Alarm
- 320.3%Severe Weather
- Fire incident types reported to NFIRS in Philadelphia, MS
- 1,63846.6%Outside Fires
- 1,27036.2%Structure Fires
- 47413.5%Mobile Property/Vehicle Fires
- 1303.7%Other
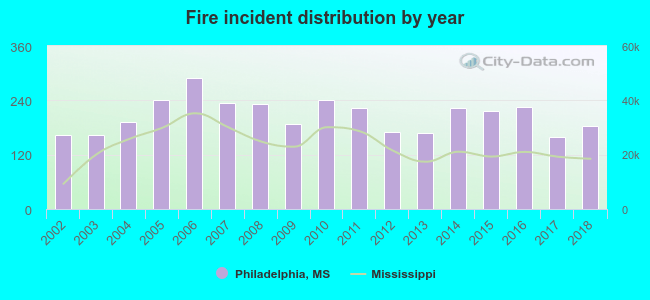 Based on the data from the years 2002 - 2018 the average number of fire incidents per year is 207. The highest number of reported fire incidents - 289 took place in 2006, and the least - 159 in 2017. The data has an increasing trend.
The average number of yearly fire incidents per 10k residents in Philadelphia, MS compared to nearest cities:
(Note: Based on data for the last 3 years, including only cities with population 5,000 and above)
| Philadelphia: | 255.8 |
| Louisville: | 176.0 |
| Kosciusko: | 78.3 |
| Forest: | 157.3 |
| Meridian: | 121.2 |
| Starkville: | 64.8 |
| Canton: | 151.2 |
 The median response time based on all reported fire incidents is 9 minutes. This is higher than the state median value.
The median response time in Philadelphia, MS compared to nearest cities:
(Note: Based on data for all years, including only cities with at least 500 fire incidents)
| Philadelphia: | 9 minutes |
| Bogue Chitto: | 11 minutes |
| Union: | 10 minutes |
| Noxapater: | 9 minutes |
| Decatur: | 8 minutes |
| Louisville: | 8 minutes |
| Carthage: | 11 minutes |
| Collinsville: | 8 minutes |
| Lena: | 7 minutes |
 Based on the reports from the years 2002 - 2018 the average number of fire-related fatalities per year is 1. The highest number of deaths - 8 took place in 2012, and the lowest - 0 in 2002. The data has an increasing trend.
The average number of deaths per 1,000 fire incidents is 7. This indicator was the highest - 47 in 2012, and the lowest 0 in 2002. The trend for deaths per 1,000 fires is growing. Compared to the state value the number of fatalities per 1,000 fires is much higher.
Based on the reports from the years 2002 - 2018 the average number of fire-related fatalities per year is 1. The highest number of deaths - 8 took place in 2012, and the lowest - 0 in 2002. The data has an increasing trend.
The average number of deaths per 1,000 fire incidents is 7. This indicator was the highest - 47 in 2012, and the lowest 0 in 2002. The trend for deaths per 1,000 fires is growing. Compared to the state value the number of fatalities per 1,000 fires is much higher.Deaths per 1,000 incidents in Philadelphia, MS compared to nearest cities:
(Note: Based on data for all years, including only cities with at least 2,500 fire incidents)
| Philadelphia: | 6.5 |
| Louisville: | 3.5 |
| Carthage: | 1.9 |
| Meridian: | 2.8 |
| Starkville: | 8.2 |
| Canton: | 1.2 |
 Based on the reports from the years 2002 - 2018 the average number of fire-related casualties per year is 1. The highest number of reported injuries - 6 took place in 2012, and the lowest - 0 in 2008. The data has a rising trend.
The average number of injuries per 1,000 fires is 7. This indicator was the highest - 35 in 2012, and the lowest 0 in 2008. The trend for injuries per 1,000 fires is rising. Compared to the Mississippi value the number of injuries per 1,000 fire incidents is higher.
Based on the reports from the years 2002 - 2018 the average number of fire-related casualties per year is 1. The highest number of reported injuries - 6 took place in 2012, and the lowest - 0 in 2008. The data has a rising trend.
The average number of injuries per 1,000 fires is 7. This indicator was the highest - 35 in 2012, and the lowest 0 in 2008. The trend for injuries per 1,000 fires is rising. Compared to the Mississippi value the number of injuries per 1,000 fire incidents is higher.Casualties per 1,000 incidents in Philadelphia, MS compared to nearest cities:
(Note: Based on data for all years, including only cities with at least 500 fire incidents)
| Philadelphia: | 6.3 |
| Bogue Chitto: | 0.0 |
| Union: | 6.2 |
| Noxapater: | 7.9 |
| Decatur: | 2.0 |
| Louisville: | 4.6 |
| Carthage: | 2.3 |
| Collinsville: | 4.5 |
| Lena: | 0.0 |
 33.9% incidents where reported in the morning and 66.1% in the evening. The most fires (15.7%) took place on Saturday, and the least (13.1%) on Thursday.
 According to the 3,512 fire incident reports from years 2002 - 2018 most fires (12.6%) took place during March, and the least (6.0%) in May.
 Out of all 12,013 cases reported during the years 2002 - 2018, the most belonged to the categories: Rescue & EMS (46.1%), Fire (29.2%), and Hazardous Condition (13.3%).
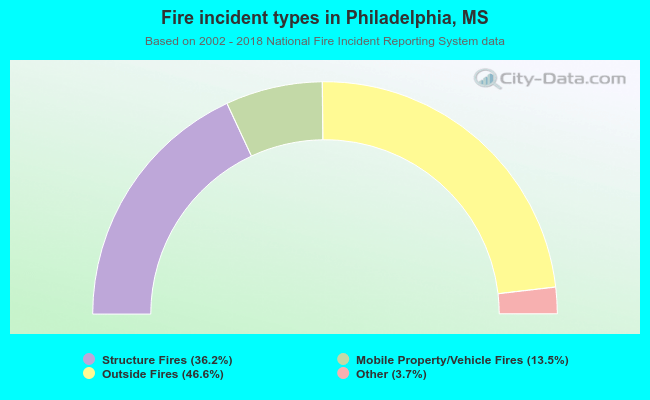 When looking into fire subcategories, the most incidents belonged to: Outside Fires (46.6%), and Structure Fires (36.2%).