Payson: Fire Incidents, Utah (UT)
Where are fire incidents reported in Payson, UT
Something went wrong! Please refresh the page.
|
| |||||||||||||||||||||||||||||||||||||||||||||||||||||||||||||||||||||||||||||||||||||||||||||||||||||||||||||
2002 - 2018 National Fire Incident Reporting System (NFIRS) incidents
- Incident types reported to NFIRS in Payson, UT
- 85426.5%Fire
- 71922.3%Hazardous Condition
- 60518.7%Rescue & EMS
- 45214.0%False Alarm
- 2848.8%Good Intent Call
- 2618.1%Service Call
- 270.8%Special Incident
- 150.5%Severe Weather
- 110.3%Overpressure Rupture
- Fire incident types reported to NFIRS in Payson, UT
- 47856.0%Outside Fires
- 19122.4%Structure Fires
- 10912.8%Mobile Property/Vehicle Fires
- 768.9%Other
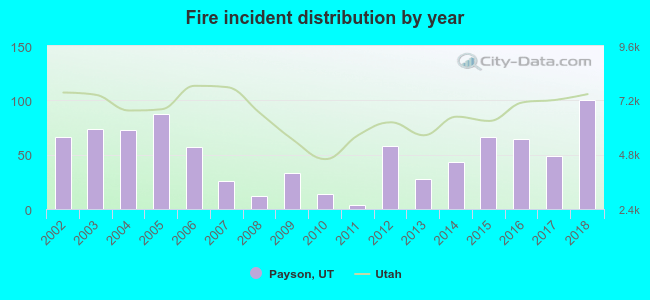 Based on the data from the years 2002 - 2018 the average number of fires per year is 50. The highest number of reported fires - 100 took place in 2018, and the least - 4 in 2011. The data has a growing trend.
The average number of yearly fire incidents per 10k residents in Payson, UT compared to nearest cities:
(Note: Based on data for the last 3 years, including only cities with population 5,000 and above)
| Payson: | 36.7 |
| Salem: | 27.2 |
| Santaquin: | 25.7 |
| Spanish Fork: | 15.4 |
| Mapleton: | 7.3 |
| Springville: | 15.4 |
| Provo: | 14.6 |
| Orem: | 14.5 |
| Lindon: | 20.8 |
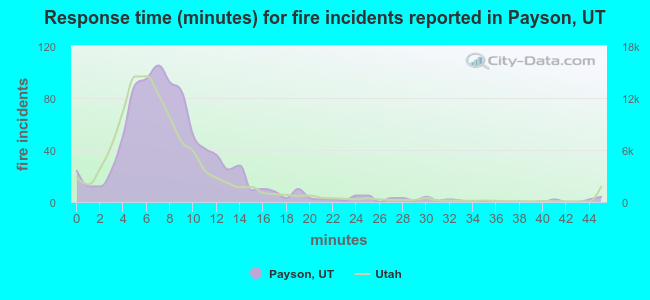 The median response time based on all reported fire incidents is 8 minutes. This is close to the state median value.
The median response time in Payson, UT compared to nearest cities:
(Note: Based on data for all years, including only cities with at least 500 fire incidents)
| Payson: | 8 minutes |
| Spanish Fork: | 8 minutes |
| Springville: | 6 minutes |
| Provo: | 6 minutes |
| Orem: | 5 minutes |
| Pleasant Grove: | 6 minutes |
| Nephi: | 11 minutes |
| Eagle Mountain: | 9 minutes |
| American Fork: | 7 minutes |
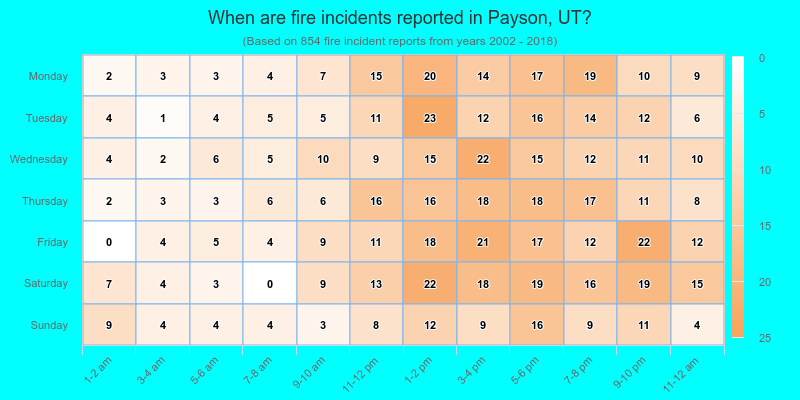
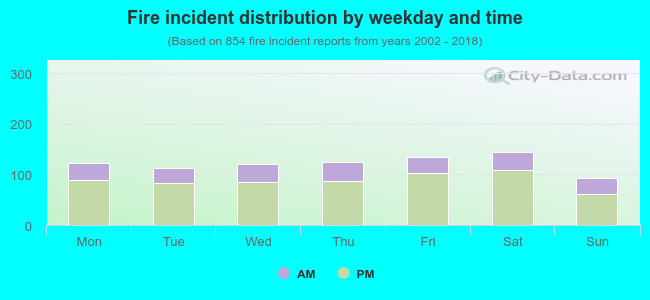 27.8% incidents where reported in the morning and 72.2% in the evening. The most fires (17.0%) took place on Saturday, and the least (10.9%) on Sunday.
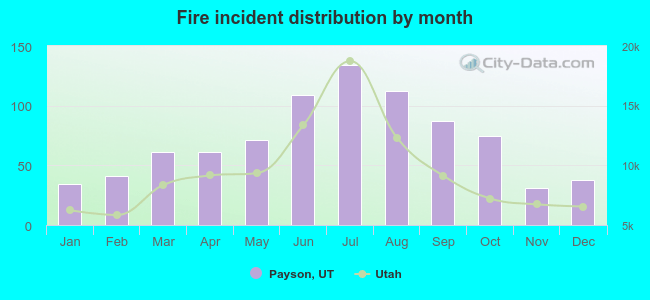 According to the 854 reports from years 2002 - 2018 most fires (15.7%) took place during July, and the least (3.6%) in November.
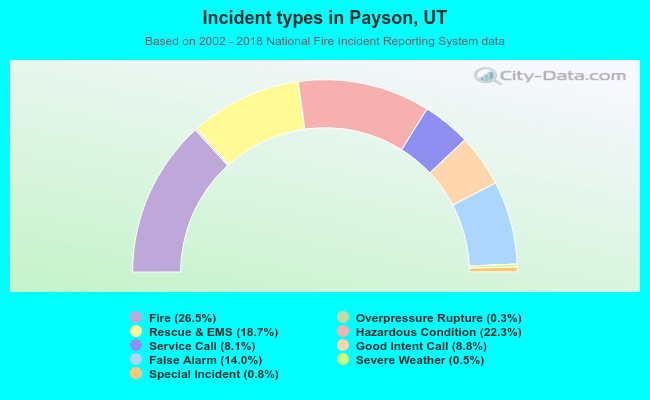 Out of all 3,228 cases reported during the years 2002 - 2018, the most belonged to the categories: Fire (26.5%), Hazardous Condition (22.3%), and Rescue & EMS (18.7%).
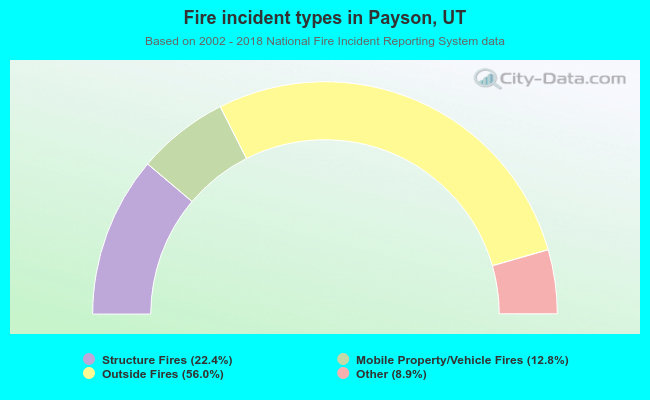 When looking into fire subcategories, the most reports belonged to: Outside Fires (56.0%), and Structure Fires (22.4%).