Oxford: Fire Incidents, Alabama (AL)
Where are fire incidents reported in Oxford, AL
Something went wrong! Please refresh the page.
| Fire incidents reported | |
|---|---|
| Sreet name | Count |
| AIRPORT RD | 190 |
| MCINTOSH RD | 135 |
| BARRY ST | 90 |
| QUINTARD DR | 90 |
| US HWY 78 | 80 |
| COLONIAL DR | 70 |
| COUNTY LINE RD | 70 |
| HWY 78 | 70 |
| I20 | 70 |
| OXFORD EXCHANGE BLVD | 65 |
| HAMRIC DR | 60 |
| I20 WB | 60 |
| INTERSTATE 20 | 60 |
| JAMBACK RD | 60 |
| OAK ST | 60 |
| PRIEBES MILL RD | 60 |
| 78 HWY | 55 |
| AL HWY | 55 |
| I20 EB | 55 |
| COLDWATER RD | 50 |
| 21 HWY | 45 |
| TAYLORS CHAPEL RD | 45 |
| FRIENDSHIP RD | 40 |
| SNOW ST | 40 |
| LEON SMITH PKY | 35 |
| SILVER RUN RD | 35 |
| 9TH ST | 30 |
| HIGHWAY 78 | 30 |
| QUINTARD AVE | 30 |
| SHORT ST | 30 |
2012 - 2018 National Fire Incident Reporting System (NFIRS) incidents
- Incident types reported to NFIRS in Oxford, AL
- 1,15127.9%Fire
- 92122.3%Rescue & EMS
- 65815.9%False Alarm
- 49011.9%Service Call
- 4109.9%Hazardous Condition
- 3849.3%Good Intent Call
- 882.1%Special Incident
- 220.5%Severe Weather
- 80.2%Overpressure Rupture
- Fire incident types reported to NFIRS in Oxford, AL
- 50043.4%Outside Fires
- 37332.4%Structure Fires
- 19817.2%Mobile Property/Vehicle Fires
- 807.0%Other
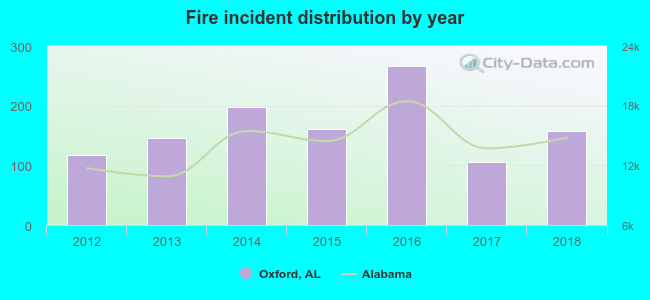 According to the data from the years 2012 - 2018 the average number of fires per year is 164. The highest number of reported fires - 266 took place in 2016, and the least - 106 in 2017. The data has an increasing trend.
The average number of yearly fire incidents per 10k residents in Oxford, AL compared to nearest cities:
(Note: Based on data for the last 3 years, including only cities with population 5,000 and above)
| Oxford: | 83.4 |
| Anniston: | 119.9 |
| Jacksonville: | 66.4 |
| Lincoln: | 170.9 |
| Talladega: | 68.3 |
| Southside: | 32.7 |
| Pell City: | 19.2 |
| Glencoe: | 85.7 |
| Rainbow City: | 50.3 |
 The median response time based on all reported fire incidents is 6 minutes. This is about the same as the state median value.
The median response time in Oxford, AL compared to nearest cities:
(Note: Based on data for all years, including only cities with at least 500 fire incidents)
| Oxford: | 6 minutes |
| Anniston: | 7 minutes |
| Heflin: | 10 minutes |
| Jacksonville: | 6 minutes |
| Talladega: | 8 minutes |
| Piedmont: | 8 minutes |
| Gadsden: | 5 minutes |
| Sylacauga: | 5 minutes |
 Based on the data from the years 2012 - 2018 the average number of fire-related casualties per year is 3. The highest number of casualties - 11 took place in 2013, and the lowest - 0 in 2017. The data has a declining trend.
The average number of casualties per 1,000 fires is 20. This indicator was the highest - 76 in 2013, and the lowest 0 in 2017. The trend for injuries per 1,000 fires is decreasing. Compared to the Alabama value the number of injuries per 1,000 fires is much higher.
Based on the data from the years 2012 - 2018 the average number of fire-related casualties per year is 3. The highest number of casualties - 11 took place in 2013, and the lowest - 0 in 2017. The data has a declining trend.
The average number of casualties per 1,000 fires is 20. This indicator was the highest - 76 in 2013, and the lowest 0 in 2017. The trend for injuries per 1,000 fires is decreasing. Compared to the Alabama value the number of injuries per 1,000 fires is much higher.
 31.0% incidents where reported in the morning and 69.0% in the evening. The most fires (16.1%) took place on Saturday, and the least (12.3%) on Sunday.
 Based on the 1,151 fires from years 2012 - 2018 most fires (12.5%) took place during October, and the least (5.8%) in May.
 Out of all 4,132 cases reported during the years 2012 - 2018, the most belonged to the categories: Fire (27.9%), Rescue & EMS (22.3%), and False Alarm (15.9%).
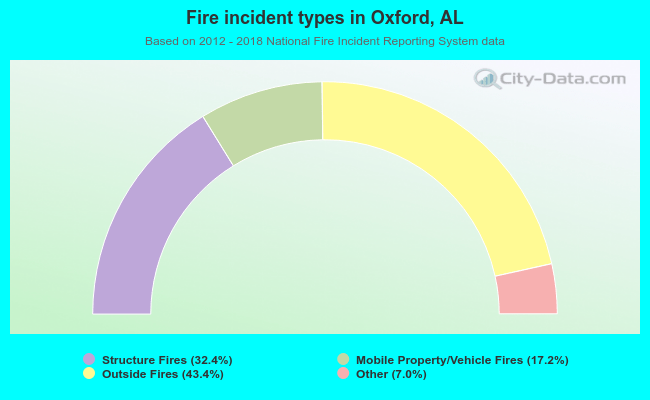 When looking into fire subcategories, the most reports belonged to: Outside Fires (43.4%), and Structure Fires (32.4%).