Oskaloosa: Fire Incidents, Iowa (IA)
Where are fire incidents reported in Oskaloosa, IA
Something went wrong! Please refresh the page.
| Fire incidents reported | |
|---|---|
| Sreet name | Count |
| HWY 92 | 66 |
| HWY 163 | 50 |
| HWY 63 | 48 |
| A AV | 34 |
| 275TH ST | 28 |
| 1ST AV | 26 |
| HIGH AV | 26 |
| NEWPORT AV | 24 |
| OSBURN AV | 24 |
| 235TH ST | 22 |
| SUFFOLK RD | 22 |
| 220TH ST | 20 |
| 275TH ST | 20 |
| A AVE WEST | 20 |
| N MARKET ST | 20 |
| 3RD AV | 18 |
| 6TH AV | 16 |
| HWY 23 | 16 |
| N 3RD ST | 16 |
| S 7TH ST | 16 |
| S MARKET ST | 16 |
| 230TH ST | 14 |
| 310TH ST | 14 |
| 9TH AV | 14 |
| C ST | 14 |
| D AV | 14 |
| HIGH AVE WEST | 14 |
| LINCOLN AV | 14 |
| N I ST | 14 |
| OSBURN AVE | 14 |
| Other | 380 |
2002 - 2018 National Fire Incident Reporting System (NFIRS) incidents
- Incident types reported to NFIRS in Oskaloosa, IA
- 1,19131.6%Hazardous Condition
- 1,05428.0%Fire
- 69718.5%Service Call
- 2747.3%False Alarm
- 2707.2%Good Intent Call
- 1945.1%Rescue & EMS
- 581.5%Severe Weather
- 210.6%Special Incident
- 120.3%Overpressure Rupture
- Fire incident types reported to NFIRS in Oskaloosa, IA
- 39537.5%Outside Fires
- 31930.3%Structure Fires
- 18817.8%Mobile Property/Vehicle Fires
- 15214.4%Other
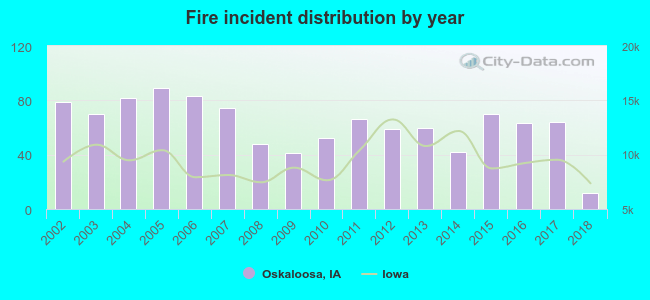 According to the data from the years 2002 - 2018 the average number of fire incidents per year is 62. The highest number of reported fire incidents - 89 took place in 2005, and the least - 12 in 2018. The data has a dropping trend.
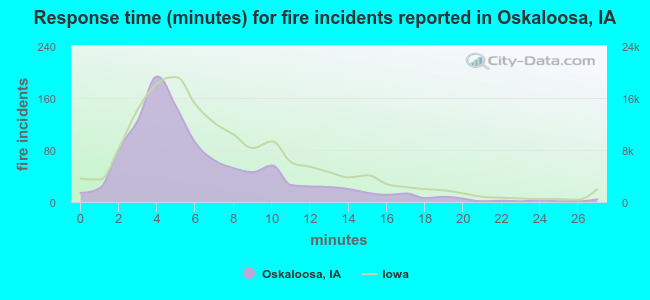 The median response time based on all reported fire incidents is 5 minutes. This is lower than the state median value.
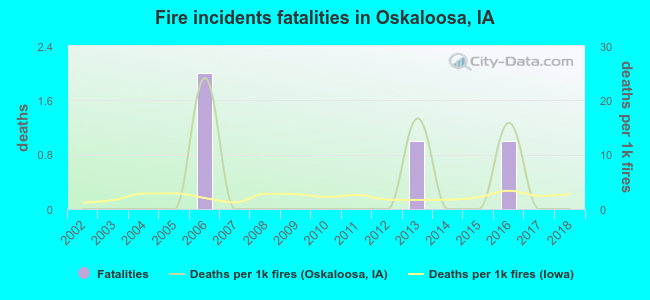 Based on the data from the years 2002 - 2018 the average number of fire-related yearly deaths is 0. The highest number of reported deaths - 2 took place in 2006, and the lowest - 0 in 2002. The data has a constant trend.
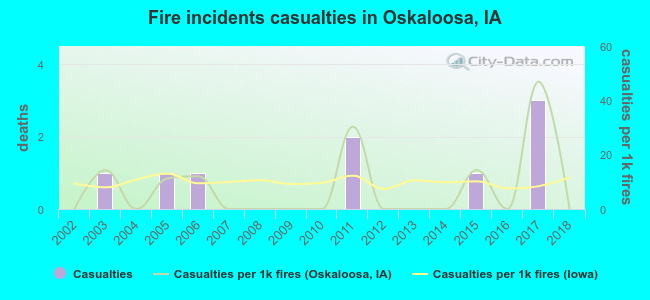 According to the reports from the years 2002 - 2018 the average number of fire-related casualties per year is 1. The highest number of reported injuries - 3 took place in 2017, and the lowest - 0 in 2002. The data has a constant trend.
The average number of injuries per 1,000 fire incidents is 8. This indicator was the highest - 47 in 2017, and the lowest 0 in 2002. The trend for injuries per 1,000 fire incidents is constant. Compared to the state value the number of injuries per 1,000 fires is about the same.
According to the reports from the years 2002 - 2018 the average number of fire-related casualties per year is 1. The highest number of reported injuries - 3 took place in 2017, and the lowest - 0 in 2002. The data has a constant trend.
The average number of injuries per 1,000 fire incidents is 8. This indicator was the highest - 47 in 2017, and the lowest 0 in 2002. The trend for injuries per 1,000 fire incidents is constant. Compared to the state value the number of injuries per 1,000 fires is about the same.
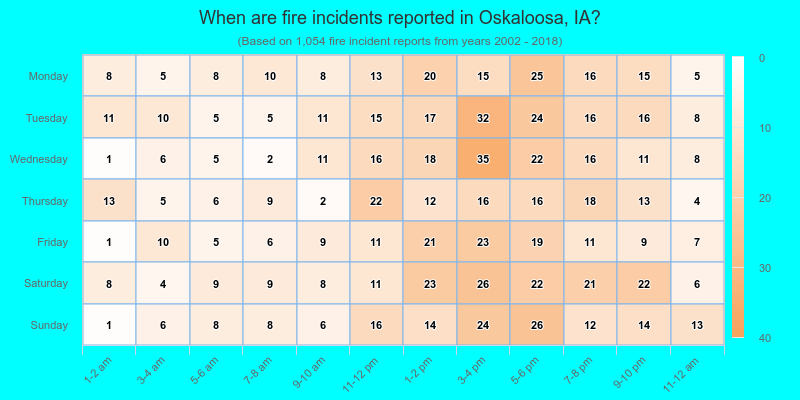
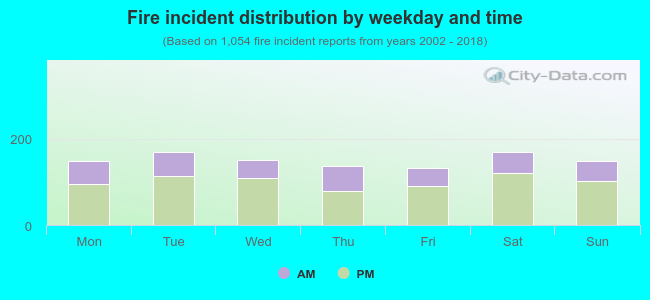 32.5% incidents where reported in the morning and 67.5% in the evening. The most fires (16.1%) took place on Tuesday, and the least (12.5%) on Friday.
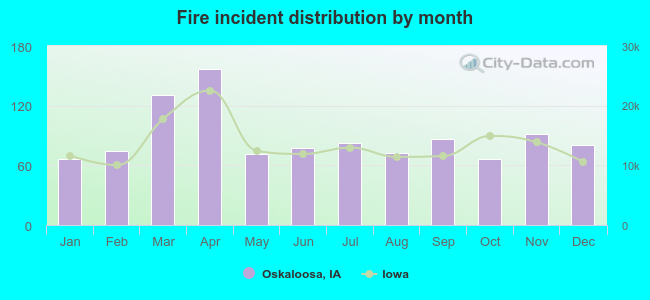 According to the 1,054 fire incident reports from years 2002 - 2018 most fires (14.9%) took place during April, and the least (6.3%) in January.
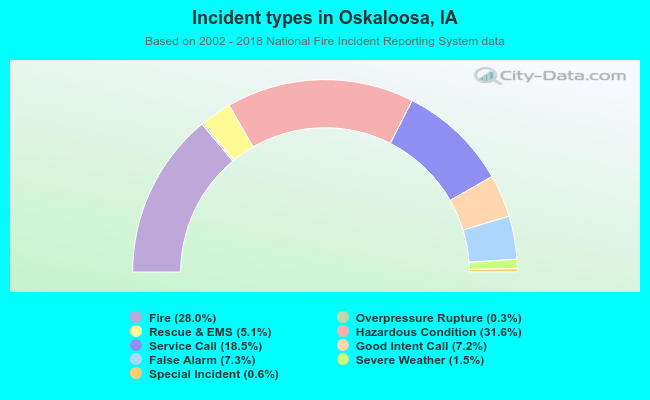 Out of all 3,771 cases reported during the years 2002 - 2018, the most belonged to the categories: Hazardous Condition (31.6%), Fire (28.0%), and Service Call (18.5%).
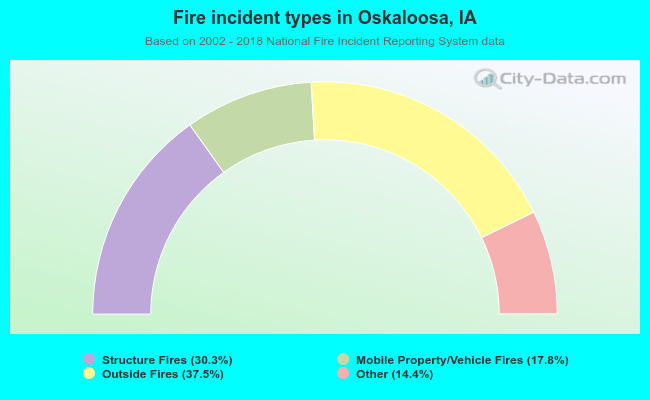 When looking into fire subcategories, the most reports belonged to: Outside Fires (37.5%), and Structure Fires (30.3%).