Oneonta: Fire Incidents, New York (NY)
Where are fire incidents reported in Oneonta, NY
Something went wrong! Please refresh the page.
| Fire incidents reported | |
|---|---|
| Sreet name | Count |
| 23 | 70 |
| MAIN ST | 62 |
| 88 | 44 |
| MAIN | 44 |
| STATE HWY 23 | 42 |
| CHESTNUT ST | 40 |
| RIVER | 28 |
| 28 | 24 |
| CHESTNUT | 20 |
| BLODGETT | 18 |
| GRAND | 18 |
| MARKET | 18 |
| WINNEY HILL RD | 18 |
| WEST ST | 16 |
| 205 | 14 |
| CLINTON | 14 |
| ONEIDA | 14 |
| STATE | 14 |
| STATE HWY 7 | 14 |
| 7 | 12 |
| FORD AV | 12 |
| MAIN ST | 12 |
| ONEIDA ST | 12 |
| STATE HWY 28 | 12 |
| 48 | 10 |
| BLODGETT DR | 10 |
| CENTER ST | 10 |
| CHESTER | 10 |
| EAST ST | 10 |
| NORTON AV | 10 |
| Other | 30 |
2002 - 2018 National Fire Incident Reporting System (NFIRS) incidents
- Incident types reported to NFIRS in Oneonta, NY
- 10,50268.8%Rescue & EMS
- 1,4569.5%Hazardous Condition
- 1,0927.2%Good Intent Call
- 1,0416.8%False Alarm
- 6824.5%Fire
- 3652.4%Service Call
- 1090.7%Severe Weather
- Fire incident types reported to NFIRS in Oneonta, NY
- 36453.4%Structure Fires
- 15122.1%Outside Fires
- 10815.8%Mobile Property/Vehicle Fires
- 598.7%Other
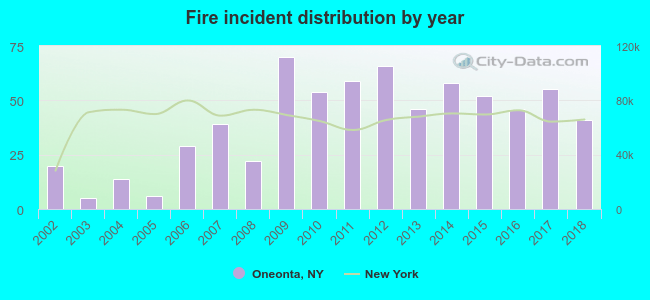 According to the data from the years 2002 - 2018 the average number of fires per year is 40. The highest number of reported fires - 70 took place in 2009, and the least - 5 in 2003. The data has a rising trend.
The average number of yearly fire incidents per 10k residents in Oneonta, NY compared to nearest cities:
(Note: Based on data for the last 3 years, including only cities with population 5,000 and above)
| Oneonta: | 34.2 |
| Norwich: | 92.3 |
 The median response time based on all reported fire incidents is 5 minutes. This is higher compared to the New York median value.
The median response time in Oneonta, NY compared to nearest cities:
(Note: Based on data for all years, including only cities with at least 500 fire incidents)
| Oneonta: | 5 minutes |
| Norwich: | 5 minutes |
 According to the data from the years 2002 - 2018 the average number of fire-related casualties per year is 1. The highest number of injuries - 6 took place in 2016, and the lowest - 0 in 2002. The data has a constant trend.
The average number of casualties per 1,000 fire incidents is 16. This indicator was the highest - 130 in 2016, and the lowest 0 in 2002. The trend for injuries per 1,000 fire incidents is constant. Compared to the New York value the number of injuries per 1,000 fire incidents is much higher.
According to the data from the years 2002 - 2018 the average number of fire-related casualties per year is 1. The highest number of injuries - 6 took place in 2016, and the lowest - 0 in 2002. The data has a constant trend.
The average number of casualties per 1,000 fire incidents is 16. This indicator was the highest - 130 in 2016, and the lowest 0 in 2002. The trend for injuries per 1,000 fire incidents is constant. Compared to the New York value the number of injuries per 1,000 fire incidents is much higher.Casualties per 1,000 incidents in Oneonta, NY compared to nearest cities:
(Note: Based on data for all years, including only cities with at least 500 fire incidents)
| Oneonta: | 20.5 |
| Norwich: | 12.9 |
 35.0% incidents where reported in the morning and 65.0% in the evening. The most fires (15.8%) took place on Tuesday, and the least (11.7%) on Wednesday.
 According to the 682 fire incidents from years 2002 - 2018 most fires (10.6%) took place during August, and the least (6.7%) in January.
 Out of all 15,265 cases reported during the years 2002 - 2018, the most belonged to the categories: Rescue & EMS (68.8%), Hazardous Condition (9.5%), and Good Intent Call (7.2%).
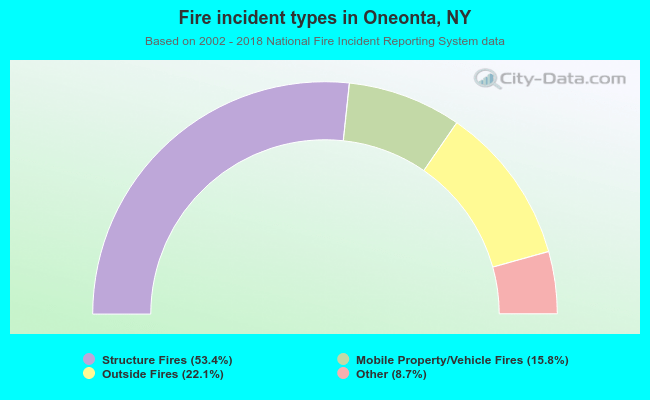 When looking into fire subcategories, the most reports belonged to: Structure Fires (53.4%), and Outside Fires (22.1%).