Olmsted Falls: Fire Incidents, Ohio (OH)
Where are fire incidents reported in Olmsted Falls, OH
Something went wrong! Please refresh the page.
|
| |||||||||||||||||||||||||||||||||||||||||||||||||||||||||||||||||||||||||||||||||||||||||||||||||||||||||||||
2002 - 2018 National Fire Incident Reporting System (NFIRS) incidents
- Incident types reported to NFIRS in Olmsted Falls, OH
- 2,53454.4%Rescue & EMS
- 72115.5%Hazardous Condition
- 4539.7%Fire
- 3888.3%Service Call
- 3176.8%False Alarm
- 2244.8%Good Intent Call
- 100.2%Overpressure Rupture
- 100.2%Special Incident
- 50.1%Severe Weather
- Fire incident types reported to NFIRS in Olmsted Falls, OH
- 24353.6%Structure Fires
- 15534.2%Outside Fires
- 4810.6%Mobile Property/Vehicle Fires
- 71.5%Other
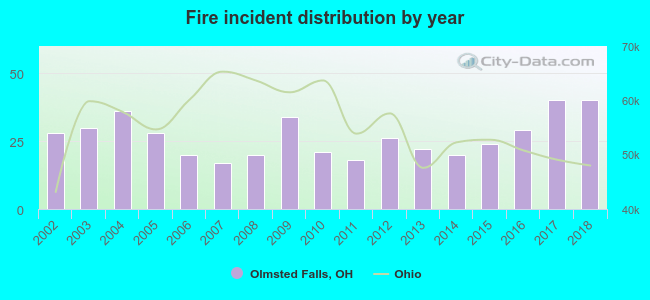 According to the data from the years 2002 - 2018 the average number of fires per year is 27. The highest number of fires - 40 took place in 2017, and the least - 17 in 2007. The data has a rising trend.
The average number of yearly fire incidents per 10k residents in Olmsted Falls, OH compared to nearest cities:
(Note: Based on data for the last 3 years, including only cities with population 5,000 and above)
| Olmsted Falls: | 40.9 |
| Berea: | 43.9 |
| North Olmsted: | 39.7 |
| Middleburg Heights: | 26.2 |
| Brook Park: | 25.1 |
| Strongsville: | 22.2 |
| North Ridgeville: | 19.5 |
| Fairview Park: | 33.2 |
| Westlake: | 30.5 |

 32.2% incidents where reported in the morning and 67.8% in the evening. The most fires (19.9%) took place on Sunday, and the least (11.3%) on Friday.
 According to the 453 fires from years 2002 - 2018 most fires (10.6%) took place during April, and the least (3.8%) in February.
 Out of all 4,662 cases reported during the years 2002 - 2018, the most belonged to the categories: Rescue & EMS (54.4%), Hazardous Condition (15.5%), and Fire (9.7%).
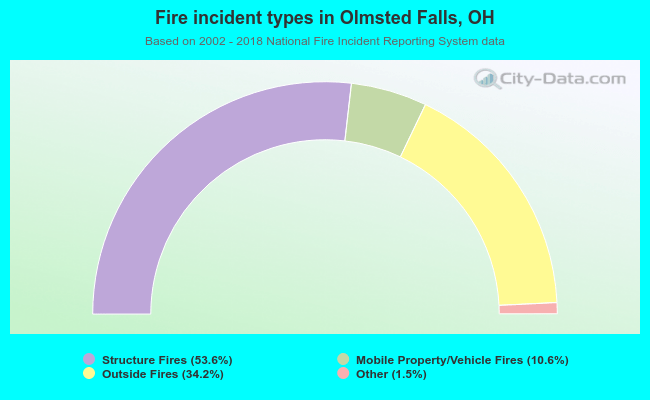 When looking into fire subcategories, the most incidents belonged to: Structure Fires (53.6%), and Outside Fires (34.2%).