Olean: Fire Incidents, New York (NY)
Where are fire incidents reported in Olean, NY
Something went wrong! Please refresh the page.
| Fire incidents reported | |
|---|---|
| Sreet name | Count |
| UNION ST | 300 |
| STATE ST | 166 |
| FRONT ST | 64 |
| SECOND ST | 50 |
| FIRST ST | 48 |
| BARRY ST | 44 |
| FOURTH ST | 44 |
| GREEN ST | 44 |
| SULLIVAN ST | 40 |
| BUFFALO ST | 38 |
| GARDEN AVE | 38 |
| HENLEY ST | 36 |
| IRVING ST | 36 |
| CLINTON ST | 34 |
| FIFTH ST | 32 |
| RT16 | 32 |
| SEVENTH ST | 32 |
| TWELFTH ST | 28 |
| THIRTEENTH ST | 26 |
| WASHINGTON ST | 26 |
| WAYNE ST | 26 |
| MAIN ST | 24 |
| SPRING ST | 24 |
| RIVERSIDE DR | 22 |
| SIXTH ST | 22 |
| THIRD ST | 22 |
| SENECA AVE | 20 |
| EIGHTH ST | 18 |
| FULTON ST | 18 |
| OAK ST | 18 |
2003 - 2018 National Fire Incident Reporting System (NFIRS) incidents
- Incident types reported to NFIRS in Olean, NY
- 6,32952.5%Rescue & EMS
- 1,80315.0%Service Call
- 1,0949.1%Fire
- 1,0809.0%False Alarm
- 9988.3%Hazardous Condition
- 6175.1%Good Intent Call
- 870.7%Severe Weather
- 200.2%Special Incident
- 190.2%Overpressure Rupture
- Fire incident types reported to NFIRS in Olean, NY
- 49345.1%Structure Fires
- 45541.6%Outside Fires
- 1059.6%Mobile Property/Vehicle Fires
- 413.7%Other
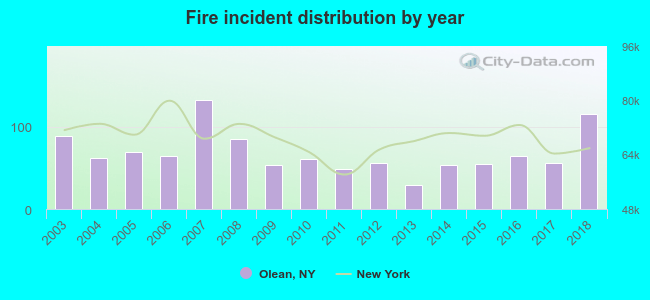 According to the data from the years 2003 - 2018 the average number of fire incidents per year is 68. The highest number of reported fires - 132 took place in 2007, and the least - 29 in 2013. The data has an increasing trend.
The average number of yearly fire incidents per 10k residents in Olean, NY compared to nearest cities:
(Note: Based on data for the last 3 years, including only cities with population 5,000 and above)
| Olean: | 56.0 |
| Salamanca: | 64.3 |
 The median response time based on all reported fire incidents is 3 minutes. This is lower compared to the New York median value.
The median response time in Olean, NY compared to nearest cities:
(Note: Based on data for all years, including only cities with at least 500 fire incidents)
| Olean: | 3 minutes |
| Salamanca: | 4 minutes |
| Springville: | 5 minutes |
 Based on the reports from the years 2003 - 2018 the average number of fire-related casualties per year is 2. The highest number of injuries - 11 took place in 2003, and the lowest - 0 in 2007. The data has a declining trend.
The average number of casualties per 1,000 fires is 28. This indicator was the highest - 124 in 2003, and the lowest 0 in 2007. The trend for casualties per 1,000 incidents is dropping. Compared to the New York value the number of injuries per 1,000 incidents is much higher.
Based on the reports from the years 2003 - 2018 the average number of fire-related casualties per year is 2. The highest number of injuries - 11 took place in 2003, and the lowest - 0 in 2007. The data has a declining trend.
The average number of casualties per 1,000 fires is 28. This indicator was the highest - 124 in 2003, and the lowest 0 in 2007. The trend for casualties per 1,000 incidents is dropping. Compared to the New York value the number of injuries per 1,000 incidents is much higher.Casualties per 1,000 incidents in Olean, NY compared to nearest cities:
(Note: Based on data for all years, including only cities with at least 500 fire incidents)
| Olean: | 28.3 |
| Salamanca: | 11.9 |
| Springville: | 0.0 |
 26.8% incidents where reported in the morning and 73.2% in the evening. The most fires (15.1%) took place on Sunday, and the least (13.3%) on Saturday.
 According to the 1,094 fires from years 2003 - 2018 most fires (13.4%) took place during July, and the least (5.9%) in January.
 Out of all 12,047 cases reported during the years 2003 - 2018, the most belonged to the categories: Rescue & EMS (52.5%), Service Call (15.0%), and Fire (9.1%).
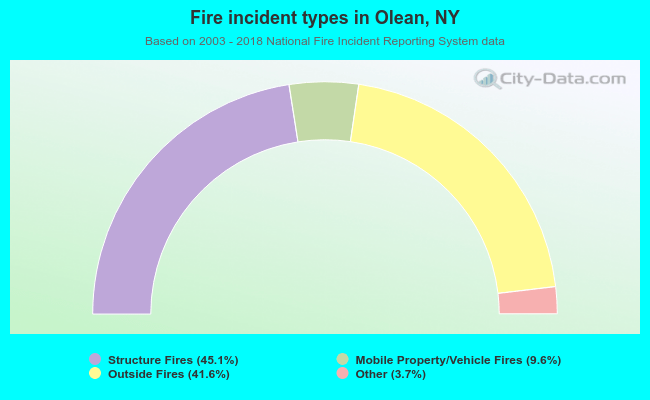 When looking into fire subcategories, the most incidents belonged to: Structure Fires (45.1%), and Outside Fires (41.6%).