North Vernon: Fire Incidents, Indiana (IN)
Where are fire incidents reported in North Vernon, IN
Something went wrong! Please refresh the page.
|
| |||||||||||||||||||||||||||||||||||||||||||||||||||||||||||||||||||||||||||||||||||||||||||||||||||||||||||||
| Other | 572 | |||||||||||||||||||||||||||||||||||||||||||||||||||||||||||||||||||||||||||||||||||||||||||||||||||||||||||||
2003 - 2018 National Fire Incident Reporting System (NFIRS) incidents
- Incident types reported to NFIRS in North Vernon, IN
- 1,33735.5%Rescue & EMS
- 1,28234.0%Fire
- 45011.9%Hazardous Condition
- 2115.6%Service Call
- 1935.1%Good Intent Call
- 1664.4%Special Incident
- 1203.2%False Alarm
- 80.2%Overpressure Rupture
- Fire incident types reported to NFIRS in North Vernon, IN
- 65851.3%Structure Fires
- 44634.8%Outside Fires
- 1179.1%Mobile Property/Vehicle Fires
- 614.8%Other
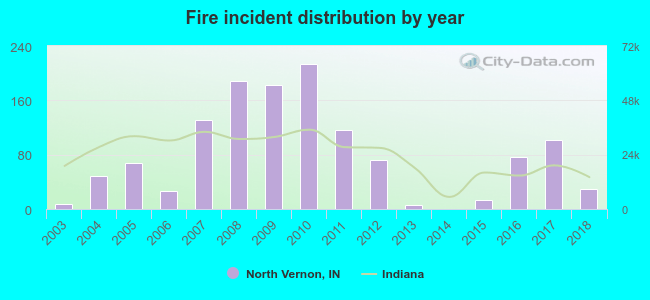 Based on the data from the years 2003 - 2018 the average number of fires per year is 80. The highest number of fire incidents - 213 took place in 2010, and the least - 0 in 2014. The data has a growing trend.
The average number of yearly fire incidents per 10k residents in North Vernon, IN compared to nearest cities:
(Note: Based on data for the last 3 years, including only cities with population 5,000 and above)
| North Vernon: | 104.0 |
| Seymour: | 27.2 |
| Columbus: | 37.4 |
| Madison: | 35.5 |
| Scottsburg: | 4.0 |
| Greensburg: | 53.0 |
| Batesville: | 22.4 |
| Shelbyville: | 38.1 |
| Salem: | 48.1 |
 The median response time based on all reported fire incidents is 9 minutes. This is higher than the Indiana median value.
The median response time in North Vernon, IN compared to nearest cities:
(Note: Based on data for all years, including only cities with at least 500 fire incidents)
| North Vernon: | 9 minutes |
| Seymour: | 4 minutes |
| Columbus: | 7 minutes |
| Madison: | 6 minutes |
| Scottsburg: | 5 minutes |
| Greensburg: | 6 minutes |
| Edinburgh: | 7 minutes |
| Nashville: | 12 minutes |
| Shelbyville: | 5 minutes |
 29.9% incidents where reported in the morning and 70.1% in the evening. The most fires (14.8%) took place on Thursday, and the least (13.3%) on Wednesday.
 According to the 1,282 fire incidents from years 2003 - 2018 most fires (12.9%) took place during March, and the least (5.5%) in December.
 Out of all 3,767 cases reported during the years 2003 - 2018, the most belonged to the categories: Rescue & EMS (35.5%), Fire (34.0%), and Hazardous Condition (11.9%).
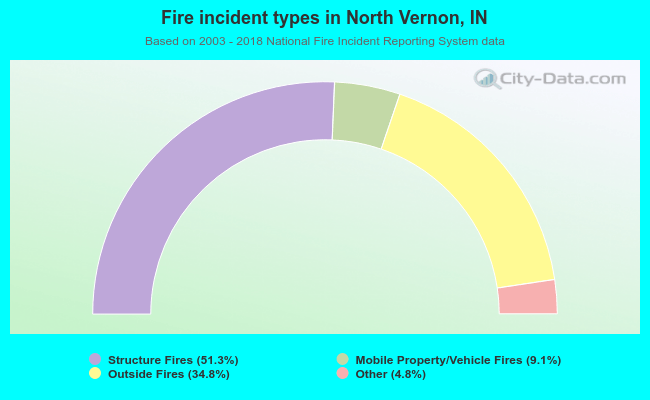 When looking into fire subcategories, the most reports belonged to: Structure Fires (51.3%), and Outside Fires (34.8%).