North Liberty: Fire Incidents, Iowa (IA)
Where are fire incidents reported in North Liberty, IA
Something went wrong! Please refresh the page.
|
| |||||||||||||||||||||||||||||||||||||||||||||||||||||||||||||||||||||||||||||||||||||||||||||||||||||||||||||
2002 - 2017 National Fire Incident Reporting System (NFIRS) incidents
- Incident types reported to NFIRS in North Liberty, IA
- 1,76846.5%Rescue & EMS
- 67317.7%Good Intent Call
- 50513.3%False Alarm
- 45111.9%Fire
- 2085.5%Hazardous Condition
- 1754.6%Service Call
- 100.3%Overpressure Rupture
- 80.2%Severe Weather
- 70.2%Special Incident
- Fire incident types reported to NFIRS in North Liberty, IA
- 21547.7%Structure Fires
- 15434.1%Outside Fires
- 7516.6%Mobile Property/Vehicle Fires
- 71.6%Other
 Based on the data from the years 2002 - 2017 the average number of fire incidents per year is 28. The highest number of fire incidents - 69 took place in 2003, and the least - 0 in 2009. The data has an increasing trend.
The average number of yearly fire incidents per 10k residents in North Liberty, IA compared to nearest cities:
(Note: Based on data for the last 3 years, including only cities with population 5,000 and above)
| North Liberty: | 15.4 |
| Coralville: | 17.0 |
| Iowa City: | 9.8 |
| Cedar Rapids: | 20.4 |
| Marion: | 16.2 |
| Hiawatha: | 46.8 |
| Anamosa: | 15.4 |
| Washington: | 43.5 |
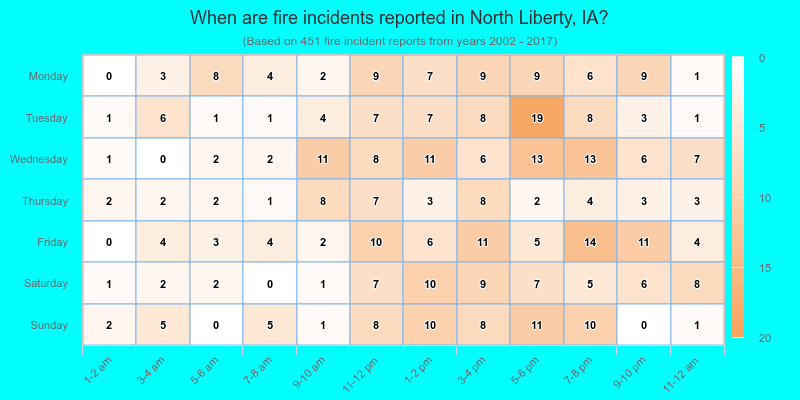
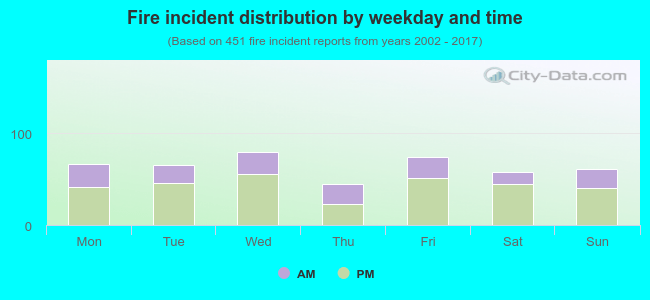 33.0% incidents where reported in the morning and 67.0% in the evening. The most fires (17.7%) took place on Wednesday, and the least (10.0%) on Thursday.
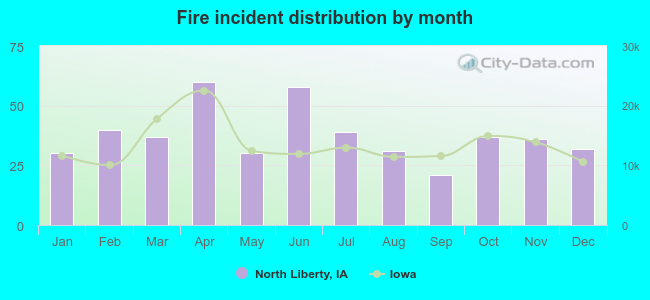 According to the 451 fire incidents from years 2002 - 2017 most fires (13.3%) took place during April, and the least (4.7%) in September.
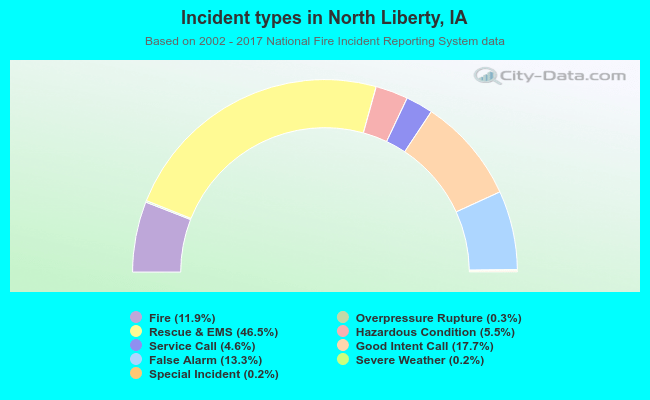 Out of all 3,805 cases reported during the years 2002 - 2017, the most belonged to the categories: Rescue & EMS (46.5%), Good Intent Call (17.7%), and False Alarm (13.3%).
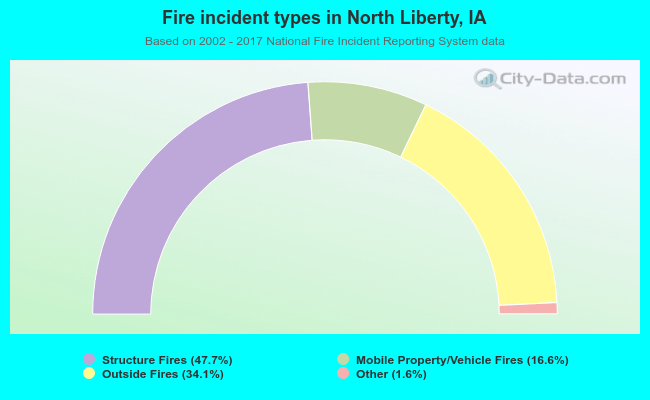 When looking into fire subcategories, the most incidents belonged to: Structure Fires (47.7%), and Outside Fires (34.1%).