North Las Vegas: Fire Incidents, Nevada (NV)
Where are fire incidents reported in North Las Vegas, NV
Something went wrong! Please refresh the page.
| Fire incidents reported | |
|---|---|
| Sreet name | Count |
| LAS VEGAS BLVD | 1,084 |
| CHEYENNE AVE | 888 |
| CRAIG RD | 810 |
| LAKE MEAD BLVD | 770 |
| CIVIC CENTER DR | 442 |
| CAREY AVE | 430 |
| LOSEE RD | 396 |
| DONNA ST | 296 |
| PECOS RD | 270 |
| ALEXANDER RD | 262 |
| I 15 | 248 |
| TONOPAH AVE | 244 |
| GOWAN RD | 230 |
| NELSON AVE | 226 |
| ANN RD | 220 |
| COMMERCE ST | 220 |
| LONE MOUNTAIN RD | 206 |
| CENTENNIAL PKY | 186 |
| 5TH ST | 174 |
| CARROLL ST | 174 |
| STATZ ST | 174 |
| DECATUR BLVD | 168 |
| SIMMONS ST | 164 |
| MCCARRAN ST | 162 |
| OWENS AVE | 162 |
| MARTIN L KING BLVD | 148 |
| ELLIS ST | 144 |
| TROPICAL PKY | 144 |
| BELMONT ST | 142 |
| REVERE ST | 142 |
| Other | 2,566 |
2002 - 2018 National Fire Incident Reporting System (NFIRS) incidents
- Incident types reported to NFIRS in North Las Vegas, NV
- 39,45959.2%Rescue & EMS
- 11,89217.8%Fire
- 8,98913.5%Good Intent Call
- 3,2824.9%Hazardous Condition
- 2,0163.0%False Alarm
- 9191.4%Service Call
- 1210.2%Special Incident
- Fire incident types reported to NFIRS in North Las Vegas, NV
- 4,96941.8%Outside Fires
- 4,18035.1%Structure Fires
- 2,19218.4%Mobile Property/Vehicle Fires
- 5514.6%Other
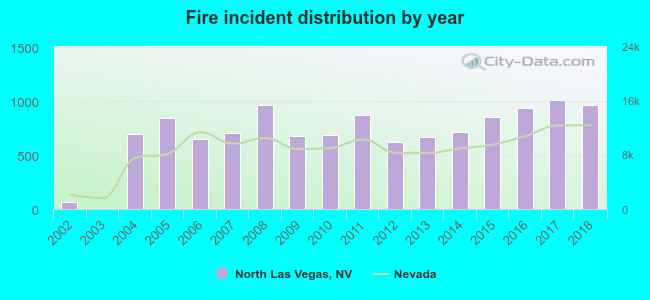 According to the data from the years 2002 - 2018 the average number of fires per year is 700. The highest number of fire incidents - 1,007 took place in 2017, and the least - 0 in 2003. The data has a growing trend.
The average number of yearly fire incidents per 10k residents in North Las Vegas, NV compared to nearest cities:
(Note: Based on data for the last 3 years, including only cities with population 5,000 and above)
| North Las Vegas: | 41.9 |
| Las Vegas: | 98.2 |
| Paradise: | 0.1 |
| Clark: | 0.3 |
| Henderson: | 21.9 |
| Boulder City: | 39.0 |
| Pahrump: | 55.1 |
| Crystal: | 1.6 |
| Mesquite: | 22.2 |
 The median response time based on all reported fire incidents is 6 minutes. This is about the same as the Nevada median value.
The median response time in North Las Vegas, NV compared to nearest cities:
(Note: Based on data for all years, including only cities with at least 500 fire incidents)
| North Las Vegas: | 6 minutes |
| Las Vegas: | 6 minutes |
| Henderson: | 7 minutes |
| Boulder City: | 6 minutes |
| Pahrump: | 7 minutes |
| Laughlin: | 6 minutes |
| Bullhead City: | 5 minutes |
| Golden Valley: | 10 minutes |
| Mohave Valley: | 7 minutes |
 According to the reports from the years 2002 - 2018 the average number of fire-related fatalities per year is 1. The highest number of reported deaths - 6 took place in 2016, and the lowest - 0 in 2002. The data has a growing trend.
The average number of fatalities per 1,000 fire incidents is 1. This indicator was the highest - 6 in 2016, and the lowest 0 in 2002. The trend for deaths per 1,000 fires is rising. Compared to the state value the number of fatalities per 1,000 fires is lower.
According to the reports from the years 2002 - 2018 the average number of fire-related fatalities per year is 1. The highest number of reported deaths - 6 took place in 2016, and the lowest - 0 in 2002. The data has a growing trend.
The average number of fatalities per 1,000 fire incidents is 1. This indicator was the highest - 6 in 2016, and the lowest 0 in 2002. The trend for deaths per 1,000 fires is rising. Compared to the state value the number of fatalities per 1,000 fires is lower.Deaths per 1,000 incidents in North Las Vegas, NV compared to nearest cities:
(Note: Based on data for all years, including only cities with at least 2,500 fire incidents)
| North Las Vegas: | 1.3 |
| Las Vegas: | 1.1 |
| Henderson: | 2.0 |
| Pahrump: | 6.6 |
| Bullhead City: | 3.6 |
| Kingman: | 0.0 |
 Based on the data from the years 2002 - 2018 the average number of fire-related casualties per year is 5. The highest number of injuries - 16 took place in 2012, and the lowest - 0 in 2002. The data has a growing trend.
The average number of casualties per 1,000 fire incidents is 6. This indicator was the highest - 26 in 2012, and the lowest 0 in 2002. The trend for injuries per 1,000 fires is growing. Compared to the state value the number of casualties per 1,000 incidents is lower.
Based on the data from the years 2002 - 2018 the average number of fire-related casualties per year is 5. The highest number of injuries - 16 took place in 2012, and the lowest - 0 in 2002. The data has a growing trend.
The average number of casualties per 1,000 fire incidents is 6. This indicator was the highest - 26 in 2012, and the lowest 0 in 2002. The trend for injuries per 1,000 fires is growing. Compared to the state value the number of casualties per 1,000 incidents is lower.Casualties per 1,000 incidents in North Las Vegas, NV compared to nearest cities:
(Note: Based on data for all years, including only cities with at least 500 fire incidents)
| North Las Vegas: | 6.7 |
| Las Vegas: | 8.7 |
| Henderson: | 12.1 |
| Boulder City: | 0.0 |
| Pahrump: | 50.4 |
| Laughlin: | 25.3 |
| Bullhead City: | 33.9 |
| Golden Valley: | 7.3 |
| Mohave Valley: | 16.8 |
 33.8% incidents where reported in the morning and 66.2% in the evening. The most fires (15.1%) took place on Sunday, and the least (13.1%) on Thursday.
 Based on the 11,892 fire incidents from years 2002 - 2018 most fires (13.4%) took place during July, and the least (6.3%) in February.
 Out of all 66,710 cases reported during the years 2002 - 2018, the most belonged to the categories: Rescue & EMS (59.2%), Fire (17.8%), and Good Intent Call (13.5%).
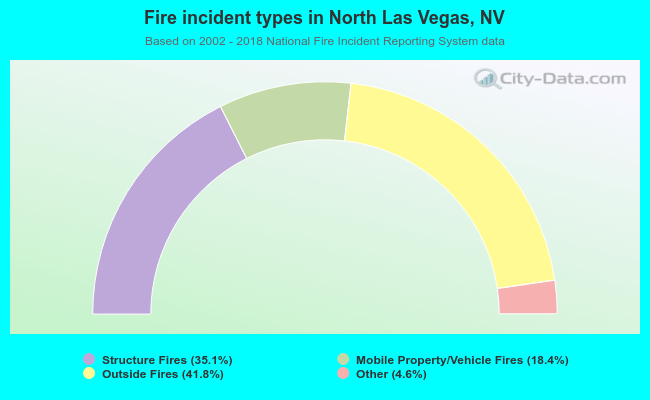 When looking into fire subcategories, the most reports belonged to: Outside Fires (41.8%), and Structure Fires (35.1%).