Newberg: Fire Incidents, Oregon (OR)
Where are fire incidents reported in Newberg, OR
Something went wrong! Please refresh the page.
| Fire incidents reported | |
|---|---|
| Sreet name | Count |
| PORTLAND RD | 198 |
| WYNOOSKI ST | 190 |
| SPRINGBROOK RD | 94 |
| COLLEGE ST | 80 |
| FIRST ST | 80 |
| 2ND ST | 74 |
| NORTH VALLEY RD | 74 |
| 1ST ST | 64 |
| WILSONVILLE RD | 56 |
| SUNNYCREST RD | 46 |
| MAIN ST | 44 |
| 9TH ST | 40 |
| BELL RD | 38 |
| HAWORTH AVE | 36 |
| MERIDIAN ST | 34 |
| RIVER ST | 34 |
| VILLA RD | 34 |
| 3RD ST | 30 |
| CRESTVIEW DR | 30 |
| CHEHALEM DR | 28 |
| HANCOCK ST | 28 |
| VITTORIA WAY | 28 |
| COLUMBIA DR | 26 |
| DEBORAH RD | 26 |
| 240 HWY | 24 |
| BALD PEAK RD | 24 |
| BLAINE ST | 24 |
| DOUGLAS AVE | 24 |
| EVEREST RD | 24 |
| WYNOOSKI | 24 |
| Other | 162 |
2002 - 2018 National Fire Incident Reporting System (NFIRS) incidents
- Incident types reported to NFIRS in Newberg, OR
- 8,33161.3%Rescue & EMS
- 1,71812.6%Fire
- 1,57611.6%Service Call
- 7565.6%Good Intent Call
- 6534.8%Hazardous Condition
- 5323.9%False Alarm
- 270.2%Severe Weather
- Fire incident types reported to NFIRS in Newberg, OR
- 75143.7%Structure Fires
- 65638.2%Outside Fires
- 22913.3%Mobile Property/Vehicle Fires
- 824.8%Other
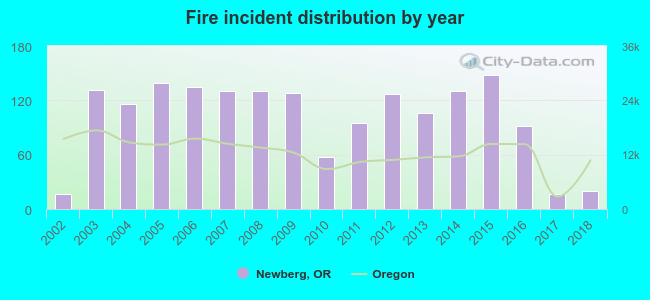 According to the data from the years 2002 - 2018 the average number of fire incidents per year is 101. The highest number of reported fires - 148 took place in 2015, and the least - 17 in 2002. The data has an increasing trend.
The average number of yearly fire incidents per 10k residents in Newberg, OR compared to nearest cities:
(Note: Based on data for the last 3 years, including only cities with population 5,000 and above)
| Newberg: | 18.9 |
| Sherwood: | 7.9 |
| Wilsonville: | 9.7 |
| Tualatin: | 14.5 |
| Woodburn: | 23.9 |
| Tigard: | 12.3 |
| McMinnville: | 7.8 |
| Aloha: | 0.9 |
| Canby: | 30.4 |
 The median response time based on all reported fire incidents is 6 minutes. This is close to the Oregon median value.
The median response time in Newberg, OR compared to nearest cities:
(Note: Based on data for all years, including only cities with at least 500 fire incidents)
| Newberg: | 6 minutes |
| Sherwood: | 7 minutes |
| Wilsonville: | 6 minutes |
| Tualatin: | 6 minutes |
| Aurora: | 11 minutes |
| Woodburn: | 7 minutes |
| Gaston: | 13 minutes |
| Tigard: | 6 minutes |
| McMinnville: | 6 minutes |
 According to the data from the years 2002 - 2018 the average number of fire-related yearly casualties is 1. The highest number of casualties - 5 took place in 2013, and the lowest - 0 in 2002. The data has a constant trend.
The average number of casualties per 1,000 fire incidents is 12. This indicator was the highest - 47 in 2013, and the lowest 0 in 2002. The trend for casualties per 1,000 incidents is constant. Compared to the Oregon value the number of casualties per 1,000 fires is similar.
According to the data from the years 2002 - 2018 the average number of fire-related yearly casualties is 1. The highest number of casualties - 5 took place in 2013, and the lowest - 0 in 2002. The data has a constant trend.
The average number of casualties per 1,000 fire incidents is 12. This indicator was the highest - 47 in 2013, and the lowest 0 in 2002. The trend for casualties per 1,000 incidents is constant. Compared to the Oregon value the number of casualties per 1,000 fires is similar.Casualties per 1,000 incidents in Newberg, OR compared to nearest cities:
(Note: Based on data for all years, including only cities with at least 500 fire incidents)
| Newberg: | 13.4 |
| Sherwood: | 8.6 |
| Wilsonville: | 11.0 |
| Tualatin: | 10.8 |
| Aurora: | 5.0 |
| Woodburn: | 4.7 |
| Gaston: | 3.0 |
| Tigard: | 16.8 |
| McMinnville: | 3.0 |
 34.0% incidents where reported in the morning and 66.0% in the evening. The most fires (15.4%) took place on Sunday, and the least (12.3%) on Tuesday.
 Based on the 1,718 fires from years 2002 - 2018 most fires (15.0%) took place during July, and the least (4.5%) in April.
 Out of all 13,598 cases reported during the years 2002 - 2018, the most belonged to the categories: Rescue & EMS (61.3%), Fire (12.6%), and Service Call (11.6%).
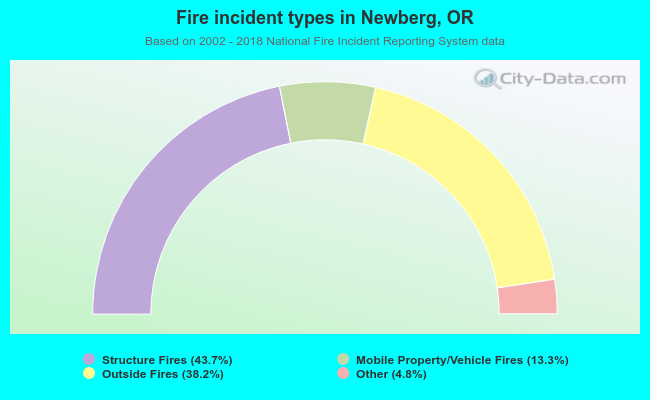 When looking into fire subcategories, the most reports belonged to: Structure Fires (43.7%), and Outside Fires (38.2%).