Nevada: Fire Incidents, Missouri (MO)
Where are fire incidents reported in Nevada, MO
Something went wrong! Please refresh the page.
| Fire incidents reported | |
|---|---|
| Sreet name | Count |
| AUSTIN BLVD | 68 |
| CEDAR ST | 58 |
| MAIN ST | 58 |
| ASH ST | 56 |
| HICKORY ST | 50 |
| CLAY ST | 48 |
| WASHINGTON ST | 46 |
| ELM ST | 44 |
| CHERRY ST | 36 |
| WALNUT ST | 36 |
| ASHLAND ST | 34 |
| AUSTIN ST | 32 |
| AUSTIN | 30 |
| LYNN ST | 30 |
| OSAGE BLVD | 30 |
| ALLISON ST | 26 |
| HIGHLAND ST | 26 |
| 54 HWY HWY | 24 |
| JEFFERSON ST | 24 |
| 1400 RD | 22 |
| NICHOLSON ST | 22 |
| OAK ST | 22 |
| SPRING ST | 22 |
| ADAMS ST | 20 |
| CLAY | 20 |
| COMMERCIAL ST | 20 |
| DOUGLAS ST | 20 |
| MAIN | 20 |
| COLORADO ST | 18 |
| HIGHLAND BLVD | 18 |
| Other | 214 |
2002 - 2018 National Fire Incident Reporting System (NFIRS) incidents
- Incident types reported to NFIRS in Nevada, MO
- 2,13630.5%Hazardous Condition
- 1,69724.2%Service Call
- 1,19417.0%Fire
- 96713.8%Rescue & EMS
- 5527.9%Good Intent Call
- 4336.2%False Alarm
- 140.2%Special Incident
- 110.2%Severe Weather
- Fire incident types reported to NFIRS in Nevada, MO
- 50542.3%Structure Fires
- 49441.4%Outside Fires
- 18115.2%Mobile Property/Vehicle Fires
- 141.2%Other
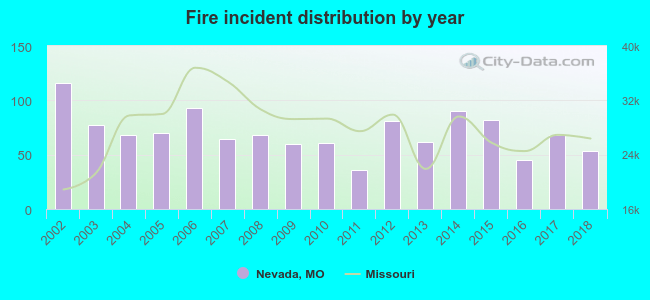 According to the data from the years 2002 - 2018 the average number of fires per year is 70. The highest number of fires - 116 took place in 2002, and the least - 36 in 2011. The data has a dropping trend.
The average number of yearly fire incidents per 10k residents in Nevada, MO compared to nearest cities:
(Note: Based on data for the last 3 years, including only cities with population 5,000 and above)
| Nevada: | 66.7 |
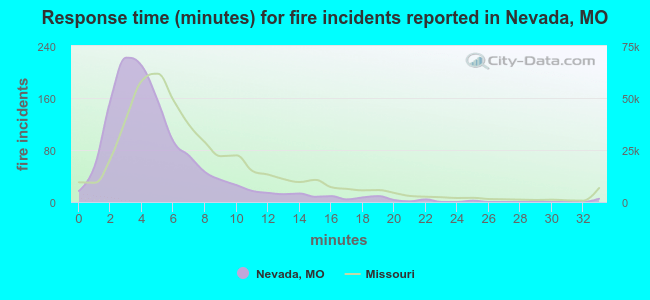 The median response time based on all reported fire incidents is 4 minutes. This is lower than the state median value.
The median response time in Nevada, MO compared to nearest cities:
(Note: Based on data for all years, including only cities with at least 500 fire incidents)
| Nevada: | 4 minutes |
| El Dorado Springs: | 9 minutes |
| Fort Scott: | 7 minutes |
| Lamar: | 5 minutes |
| Stockton: | 11 minutes |
| Pittsburg: | 3 minutes |
| Osceola: | 13 minutes |
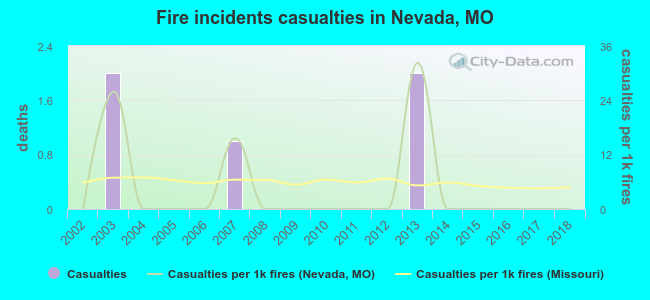 According to the reports from the years 2002 - 2018 the average number of fire-related casualties per year is 0. The highest number of reported casualties - 2 took place in 2003, and the lowest - 0 in 2002. The data has a constant trend.
The average number of injuries per 1,000 fires is 4. This indicator was the highest - 32 in 2013, and the lowest 0 in 2002. The trend for injuries per 1,000 fire incidents is constant. Compared to the state value the number of injuries per 1,000 fire incidents is lower.
According to the reports from the years 2002 - 2018 the average number of fire-related casualties per year is 0. The highest number of reported casualties - 2 took place in 2003, and the lowest - 0 in 2002. The data has a constant trend.
The average number of injuries per 1,000 fires is 4. This indicator was the highest - 32 in 2013, and the lowest 0 in 2002. The trend for injuries per 1,000 fire incidents is constant. Compared to the state value the number of injuries per 1,000 fire incidents is lower.Casualties per 1,000 incidents in Nevada, MO compared to nearest cities:
(Note: Based on data for all years, including only cities with at least 500 fire incidents)
| Nevada: | 4.2 |
| El Dorado Springs: | 19.1 |
| Fort Scott: | 3.7 |
| Lamar: | 1.2 |
| Stockton: | 2.8 |
| Pittsburg: | 8.4 |
| Osceola: | 1.9 |
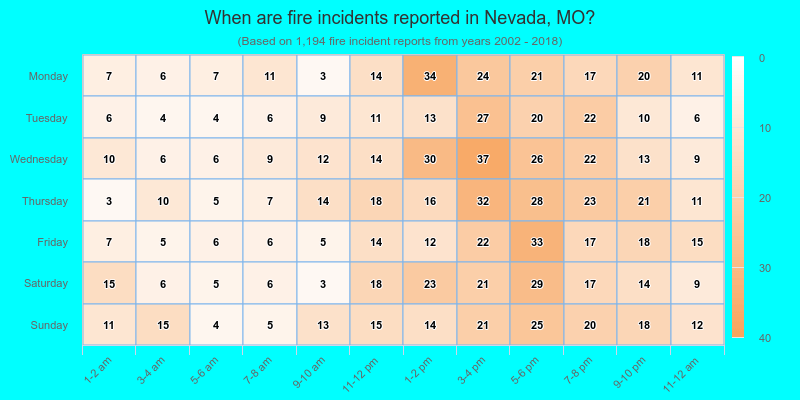
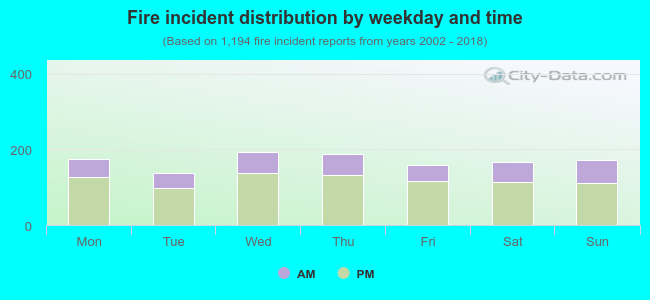 30.2% incidents where reported in the morning and 69.8% in the evening. The most fires (16.2%) took place on Wednesday, and the least (11.6%) on Tuesday.
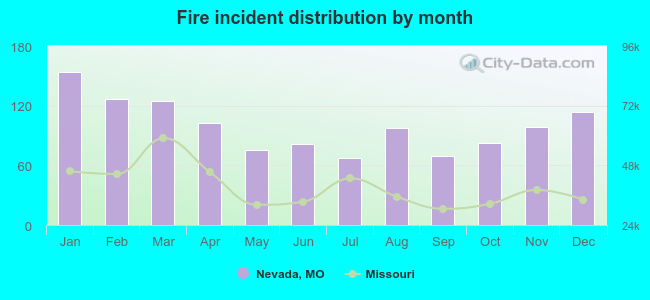 Based on the 1,194 fires from years 2002 - 2018 most fires (12.9%) took place during January, and the least (5.6%) in July.
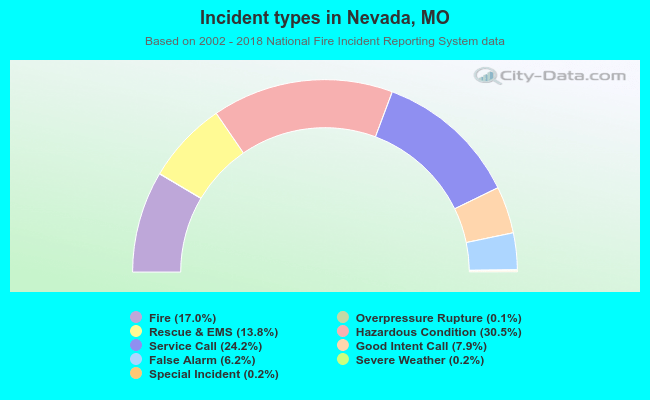 Out of all 7,009 cases reported during the years 2002 - 2018, the most belonged to the categories: Hazardous Condition (30.5%), Service Call (24.2%), and Fire (17.0%).
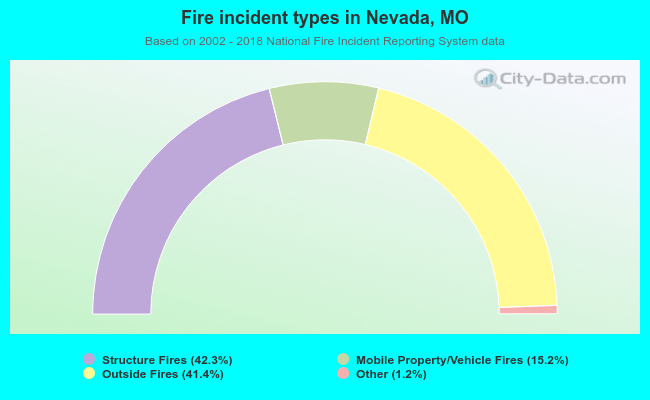 When looking into fire subcategories, the most reports belonged to: Structure Fires (42.3%), and Outside Fires (41.4%).