Mountain Home: Fire Incidents, Arkansas (AR)
Where are fire incidents reported in Mountain Home, AR
Something went wrong! Please refresh the page.
| Fire incidents reported | |
|---|---|
| Sreet name | Count |
| HWY 62 | 228 |
| HWY 5 | 152 |
| HWY 201 | 136 |
| CR 25 | 58 |
| CR 27 | 50 |
| CARDINAL DR | 48 |
| 9TH ST | 46 |
| COLLEGE ST | 42 |
| HIGHWAY 5 HWY | 36 |
| 16TH ST | 34 |
| OLD TRACY ROAD RD | 32 |
| 6TH ST | 28 |
| CANNIE BAKER RD | 26 |
| MAIN ST | 24 |
| OLD ARKANA RD | 24 |
| WEST RD | 24 |
| BUFORD RD | 22 |
| CHURCH ST | 22 |
| HWY 62 BY PASS | 22 |
| 1ST ST | 20 |
| CARTNEY ROAD | 20 |
| GLENBRIAR DR | 20 |
| ROSSI RD | 20 |
| COLEY DR | 18 |
| CR 39 | 18 |
| SYCAMORE SPRINGS ROAD HWY | 18 |
| WAL-MART DR | 18 |
| 4TH ST | 16 |
| BUZZARD ROOST CUTOFF | 16 |
| CAMPBELL DR | 16 |
| Other | 1,197 |
2002 - 2018 National Fire Incident Reporting System (NFIRS) incidents
- Incident types reported to NFIRS in Mountain Home, AR
- 8,48262.2%Rescue & EMS
- 2,45118.0%Fire
- 8836.5%Service Call
- 6144.5%Good Intent Call
- 5784.2%Hazardous Condition
- 5754.2%False Alarm
- 340.2%Special Incident
- Fire incident types reported to NFIRS in Mountain Home, AR
- 1,30553.2%Outside Fires
- 75030.6%Structure Fires
- 26911.0%Mobile Property/Vehicle Fires
- 1275.2%Other
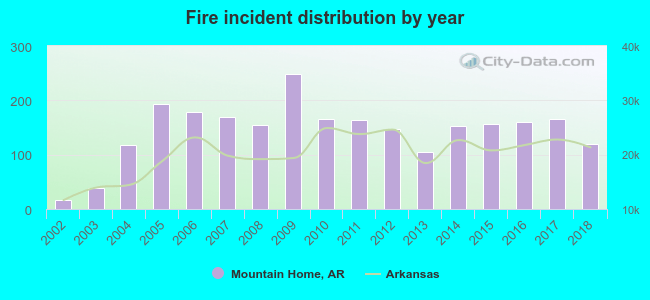 Based on the data from the years 2002 - 2018 the average number of fire incidents per year is 144. The highest number of reported fire incidents - 248 took place in 2009, and the least - 17 in 2002. The data has a rising trend.
The average number of yearly fire incidents per 10k residents in Mountain Home, AR compared to nearest cities:
(Note: Based on data for the last 3 years, including only cities with population 5,000 and above)
| Mountain Home: | 121.1 |
| Harrison: | 119.8 |
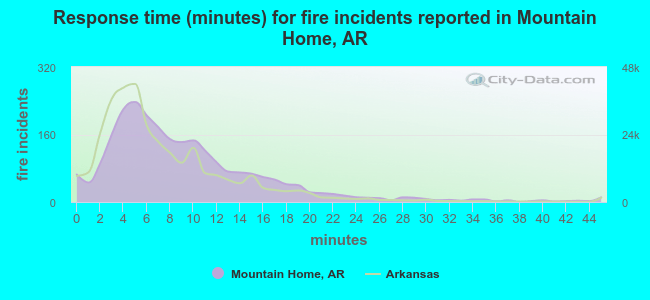 The median response time based on all reported fire incidents is 8 minutes. This is higher than the Arkansas median value.
The median response time in Mountain Home, AR compared to nearest cities:
(Note: Based on data for all years, including only cities with at least 500 fire incidents)
| Mountain Home: | 8 minutes |
| Gassville: | 8 minutes |
| Flippin: | 10 minutes |
| Yellville: | 12 minutes |
| Viola: | 10 minutes |
| Melbourne: | 10 minutes |
| Mountain View: | 9 minutes |
| Harrison: | 6 minutes |
| Ash Flat: | 6 minutes |
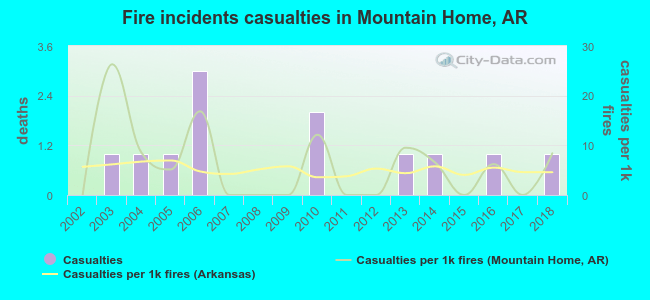 According to the reports from the years 2002 - 2018 the average number of fire-related casualties per year is 1. The highest number of reported casualties - 3 took place in 2006, and the lowest - 0 in 2002. The data has an increasing trend.
The average number of casualties per 1,000 fires is 6. This indicator was the highest - 26 in 2003, and the lowest 0 in 2002. The trend for injuries per 1,000 fire incidents is rising. Compared to the state value the number of casualties per 1,000 incidents is about the same.
According to the reports from the years 2002 - 2018 the average number of fire-related casualties per year is 1. The highest number of reported casualties - 3 took place in 2006, and the lowest - 0 in 2002. The data has an increasing trend.
The average number of casualties per 1,000 fires is 6. This indicator was the highest - 26 in 2003, and the lowest 0 in 2002. The trend for injuries per 1,000 fire incidents is rising. Compared to the state value the number of casualties per 1,000 incidents is about the same.
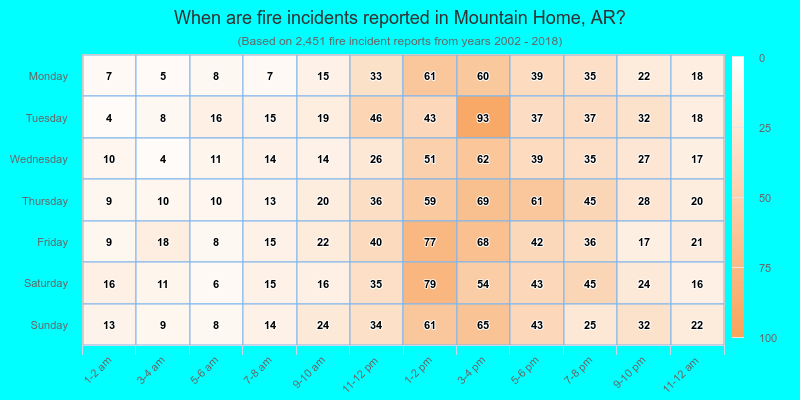
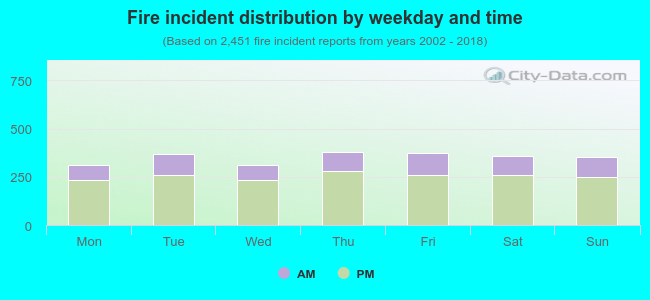 27.5% incidents where reported in the morning and 72.5% in the evening. The most fires (15.5%) took place on Thursday, and the least (12.6%) on Monday.
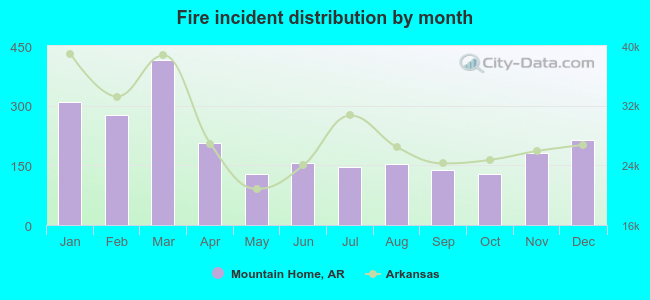 Based on the 2,451 fire incident reports from years 2002 - 2018 most fires (17.0%) took place during March, and the least (5.2%) in May.
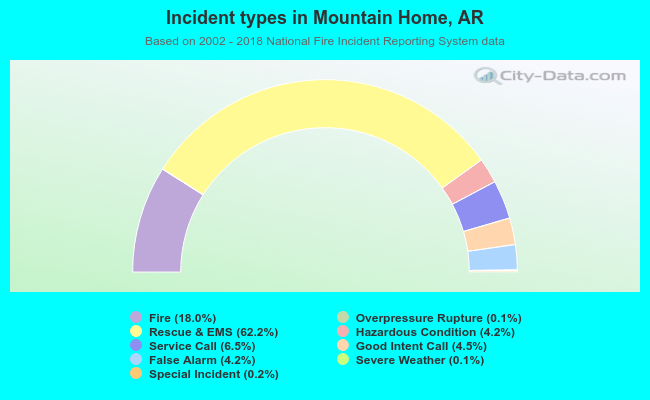 Out of all 13,635 cases reported during the years 2002 - 2018, the most belonged to the categories: Rescue & EMS (62.2%), Fire (18.0%), and Service Call (6.5%).
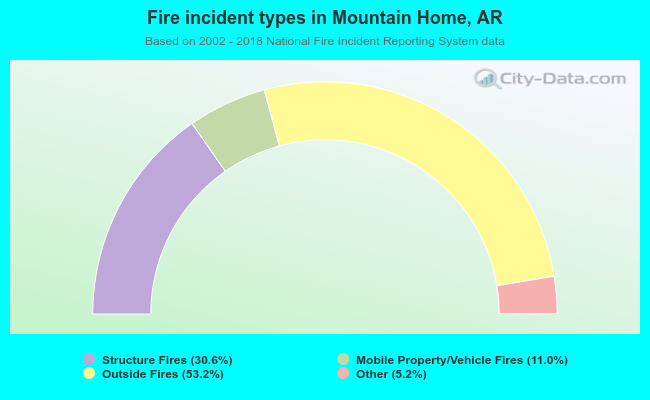 When looking into fire subcategories, the most incidents belonged to: Outside Fires (53.2%), and Structure Fires (30.6%).