Mount Vernon: Fire Incidents, New York (NY)
Where are fire incidents reported in Mount Vernon, NY
Something went wrong! Please refresh the page.
| Fire incidents reported | |
|---|---|
| Sreet name | Count |
| 3RD AVE | 208 |
| 5TH AVE | 166 |
| S 1ST AV | 164 |
| 7TH AVE | 162 |
| GRAMATAN AVE | 152 |
| 2ND AVE | 136 |
| 3RD ST | 136 |
| 1ST AVE | 126 |
| COLUMBUS AVE | 126 |
| LINCOLN AVE | 126 |
| 4TH ST | 124 |
| 9TH AVE | 122 |
| FRANKLIN AVE | 122 |
| S 7TH AV | 120 |
| S 5TH AV | 110 |
| FULTON AVE | 108 |
| HIGH ST | 106 |
| 10TH AVE | 104 |
| E 3RD ST | 102 |
| GRAMATAN AV | 98 |
| MOUNT VERNON AVE | 96 |
| SIDNEY AVE | 92 |
| S 2ND AV | 90 |
| S 3RD AV | 82 |
| 1ST ST | 80 |
| 4TH AVE | 80 |
| TERRACE AVE | 78 |
| 8TH AVE | 76 |
| E 4TH ST | 74 |
| SANDFORD BLVD | 70 |
| Other | 793 |
2002 - 2018 National Fire Incident Reporting System (NFIRS) incidents
- Incident types reported to NFIRS in Mount Vernon, NY
- 36,00160.1%Rescue & EMS
- 9,27515.5%Hazardous Condition
- 4,4757.5%False Alarm
- 4,2297.1%Fire
- 3,3865.6%Service Call
- 2,5304.2%Good Intent Call
- Fire incident types reported to NFIRS in Mount Vernon, NY
- 3,03671.8%Structure Fires
- 67415.9%Outside Fires
- 45910.9%Mobile Property/Vehicle Fires
- 601.4%Other
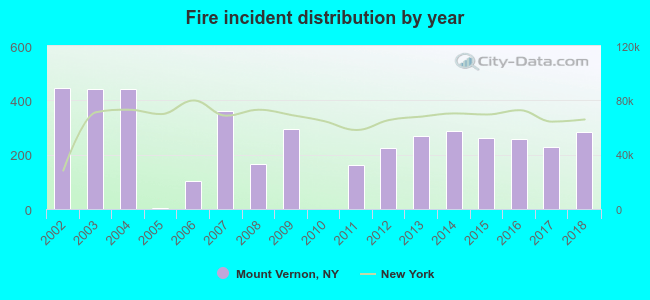 Based on the data from the years 2002 - 2018 the average number of fire incidents per year is 249. The highest number of reported fires - 445 took place in 2002, and the least - 0 in 2010. The data has a declining trend.
The average number of yearly fire incidents per 10k residents in Mount Vernon, NY compared to nearest cities:
(Note: Based on data for the last 3 years, including only cities with population 5,000 and above)
| Mount Vernon: | 37.5 |
| Pelham: | 37.0 |
| Bronxville: | 42.1 |
| Pelham Manor: | 26.9 |
| Yonkers: | 65.3 |
| New Rochelle: | 75.2 |
| Tuckahoe: | 45.8 |
| Eastchester: | 27.6 |
| Larchmont: | 22.9 |
 The median response time based on all reported fire incidents is 4 minutes. This is about the same as the state median value.
The median response time in Mount Vernon, NY compared to nearest cities:
(Note: Based on data for all years, including only cities with at least 500 fire incidents)
| Mount Vernon: | 4 minutes |
| Yonkers: | 5 minutes |
| New Rochelle: | 6 minutes |
| Eastchester: | 5 minutes |
| Larchmont: | 2 minutes |
| Scarsdale: | 4 minutes |
| Dobbs Ferry: | 3 minutes |
| Englewood: | 4 minutes |
| Hartsdale: | 4 minutes |
 Based on the data from the years 2002 - 2018 the average number of fire-related fatalities per year is 1. The highest number of deaths - 5 took place in 2013, and the lowest - 0 in 2003. The data has a dropping trend.
The average number of deaths per 1,000 fire incidents is 3. This indicator was the highest - 19 in 2013, and the lowest 0 in 2003. The trend for deaths per 1,000 incidents is declining. Compared to the New York value the number of deaths per 1,000 incidents is much higher.
Based on the data from the years 2002 - 2018 the average number of fire-related fatalities per year is 1. The highest number of deaths - 5 took place in 2013, and the lowest - 0 in 2003. The data has a dropping trend.
The average number of deaths per 1,000 fire incidents is 3. This indicator was the highest - 19 in 2013, and the lowest 0 in 2003. The trend for deaths per 1,000 incidents is declining. Compared to the New York value the number of deaths per 1,000 incidents is much higher.Deaths per 1,000 incidents in Mount Vernon, NY compared to nearest cities:
(Note: Based on data for all years, including only cities with at least 2,500 fire incidents)
| Mount Vernon: | 2.8 |
| Yonkers: | 0.3 |
| New Rochelle: | 1.0 |
| Englewood: | 1.1 |
| White Plains: | 0.0 |
| Teaneck: | 3.5 |
 According to the data from the years 2002 - 2018 the average number of fire-related yearly casualties is 2. The highest number of injuries - 10 took place in 2017, and the lowest - 0 in 2005. The data has a dropping trend.
The average number of casualties per 1,000 fire incidents is 8. This indicator was the highest - 44 in 2017, and the lowest 0 in 2005. The trend for casualties per 1,000 fire incidents is growing. Compared to the state value the number of casualties per 1,000 fires is similar.
According to the data from the years 2002 - 2018 the average number of fire-related yearly casualties is 2. The highest number of injuries - 10 took place in 2017, and the lowest - 0 in 2005. The data has a dropping trend.
The average number of casualties per 1,000 fire incidents is 8. This indicator was the highest - 44 in 2017, and the lowest 0 in 2005. The trend for casualties per 1,000 fire incidents is growing. Compared to the state value the number of casualties per 1,000 fires is similar.Casualties per 1,000 incidents in Mount Vernon, NY compared to nearest cities:
(Note: Based on data for all years, including only cities with at least 500 fire incidents)
| Mount Vernon: | 9.7 |
| Yonkers: | 6.4 |
| New Rochelle: | 2.0 |
| Eastchester: | 11.6 |
| Larchmont: | 8.9 |
| Scarsdale: | 5.5 |
| Dobbs Ferry: | 1.9 |
| Englewood: | 6.3 |
| Hartsdale: | 15.9 |
 35.6% incidents where reported in the morning and 64.4% in the evening. The most fires (16.1%) took place on Sunday, and the least (13.3%) on Wednesday.
 Based on the 4,229 incident reports from years 2002 - 2018 most fires (10.4%) took place during March, and the least (6.6%) in September.
 Out of all 59,947 cases reported during the years 2002 - 2018, the most belonged to the categories: Rescue & EMS (60.1%), Hazardous Condition (15.5%), and False Alarm (7.5%).
 When looking into fire subcategories, the most incidents belonged to: Structure Fires (71.8%), and Outside Fires (15.9%).