Monroe: Fire Incidents, North Carolina (NC)
Where are fire incidents reported in Monroe, NC
Something went wrong! Please refresh the page.
| Fire incidents reported | |
|---|---|
| Sreet name | Count |
| ROOSEVELT BLVD | 470 |
| ROCKY RIVER RD | 210 |
| SUNSET DR | 134 |
| MORGAN MILL RD | 102 |
| WALKUP AVE | 96 |
| PAGELAND HWY | 94 |
| OLD CHARLOTTE HWY | 92 |
| SIKES MILL RD | 90 |
| HWY 74 | 86 |
| ASHCRAFT AVE | 80 |
| STACK RD | 78 |
| FRANKLIN ST | 76 |
| CONCORD HWY | 74 |
| WEDDINGTON RD | 66 |
| LANCASTER HWY | 64 |
| WAXHAW HWY | 64 |
| SECREST SHORT CUT RD | 62 |
| GOLDMINE RD | 60 |
| GRIFFITH RD | 58 |
| ICEMORLEE ST | 58 |
| PLYLER MILL RD | 58 |
| WOLF POND RD | 58 |
| UNIONVILLE BRIEF RD | 56 |
| CHARLOTTE AVE | 54 |
| MEDLIN RD | 54 |
| RIDGE RD | 52 |
| SANDY RIDGE RD | 52 |
| HWY 218 | 50 |
| MAURICE ST | 50 |
| JOHNSON ST | 48 |
| Other | 1,409 |
2002 - 2018 National Fire Incident Reporting System (NFIRS) incidents
- Incident types reported to NFIRS in Monroe, NC
- 25,27955.8%Rescue & EMS
- 5,41611.9%Good Intent Call
- 4,68010.3%Hazardous Condition
- 4,0558.9%Fire
- 3,2377.1%Service Call
- 2,5225.6%False Alarm
- 660.1%Overpressure Rupture
- Fire incident types reported to NFIRS in Monroe, NC
- 1,61739.9%Outside Fires
- 1,50037.0%Structure Fires
- 67416.6%Mobile Property/Vehicle Fires
- 2646.5%Other
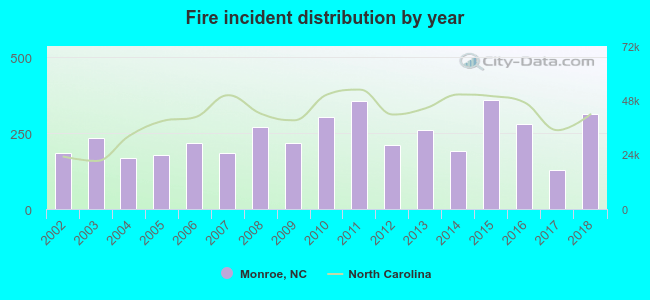 Based on the data from the years 2002 - 2018 the average number of fires per year is 239. The highest number of reported fire incidents - 358 took place in 2015, and the least - 129 in 2017. The data has a rising trend.
The average number of yearly fire incidents per 10k residents in Monroe, NC compared to nearest cities:
(Note: Based on data for the last 3 years, including only cities with population 5,000 and above)
| Monroe: | 70.1 |
| Unionville: | 1.6 |
| Wesley Chapel: | 13.4 |
| Indian Trail: | 24.3 |
| Stallings: | 19.4 |
| Weddington: | 13.6 |
| Waxhaw: | 59.1 |
| Matthews: | 16.6 |
| Mint Hill: | 26.7 |
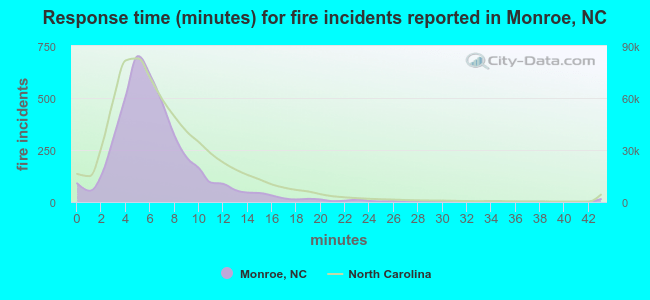 The median response time based on all reported fire incidents is 6 minutes. This is about the same as the North Carolina median value.
The median response time in Monroe, NC compared to nearest cities:
(Note: Based on data for all years, including only cities with at least 500 fire incidents)
| Monroe: | 6 minutes |
| Indian Trail: | 7 minutes |
| Marshville: | 8 minutes |
| Waxhaw: | 8 minutes |
| Matthews: | 7 minutes |
| Mint Hill: | 7 minutes |
| Pineville: | 7 minutes |
| Charlotte: | 5 minutes |
| Wadesboro: | 5 minutes |
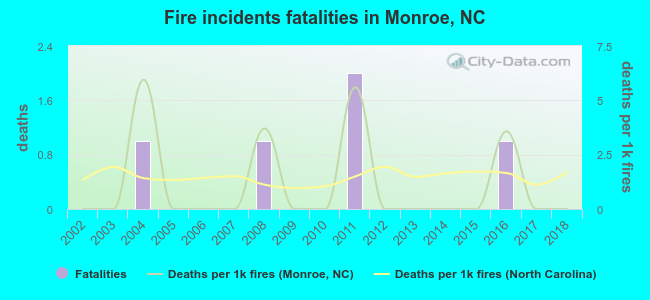 According to the reports from the years 2002 - 2018 the average number of fire-related yearly deaths is 0. The highest number of deaths - 2 took place in 2011, and the lowest - 0 in 2002. The data has a constant trend.
The average number of deaths per 1,000 fires is 1. This indicator was the highest - 6 in 2004, and the lowest 0 in 2002. The trend for fatalities per 1,000 fire incidents is constant. Compared to the North Carolina value the number of deaths per 1,000 fire incidents is about the same.
According to the reports from the years 2002 - 2018 the average number of fire-related yearly deaths is 0. The highest number of deaths - 2 took place in 2011, and the lowest - 0 in 2002. The data has a constant trend.
The average number of deaths per 1,000 fires is 1. This indicator was the highest - 6 in 2004, and the lowest 0 in 2002. The trend for fatalities per 1,000 fire incidents is constant. Compared to the North Carolina value the number of deaths per 1,000 fire incidents is about the same.
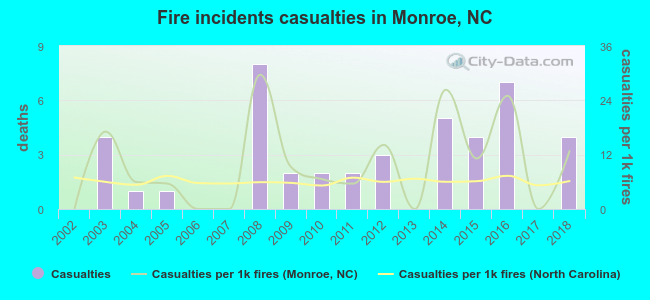 According to the reports from the years 2002 - 2018 the average number of fire-related casualties per year is 3. The highest number of injuries - 8 took place in 2008, and the lowest - 0 in 2002. The data has a rising trend.
The average number of injuries per 1,000 fire incidents is 10. This indicator was the highest - 30 in 2008, and the lowest 0 in 2002. The trend for injuries per 1,000 fire incidents is growing. Compared to the state value the number of casualties per 1,000 incidents is higher.
According to the reports from the years 2002 - 2018 the average number of fire-related casualties per year is 3. The highest number of injuries - 8 took place in 2008, and the lowest - 0 in 2002. The data has a rising trend.
The average number of injuries per 1,000 fire incidents is 10. This indicator was the highest - 30 in 2008, and the lowest 0 in 2002. The trend for injuries per 1,000 fire incidents is growing. Compared to the state value the number of casualties per 1,000 incidents is higher.Casualties per 1,000 incidents in Monroe, NC compared to nearest cities:
(Note: Based on data for all years, including only cities with at least 500 fire incidents)
| Monroe: | 10.6 |
| Indian Trail: | 3.3 |
| Marshville: | 1.2 |
| Waxhaw: | 1.0 |
| Matthews: | 13.5 |
| Mint Hill: | 1.3 |
| Pineville: | 11.5 |
| Charlotte: | 11.4 |
| Wadesboro: | 13.7 |
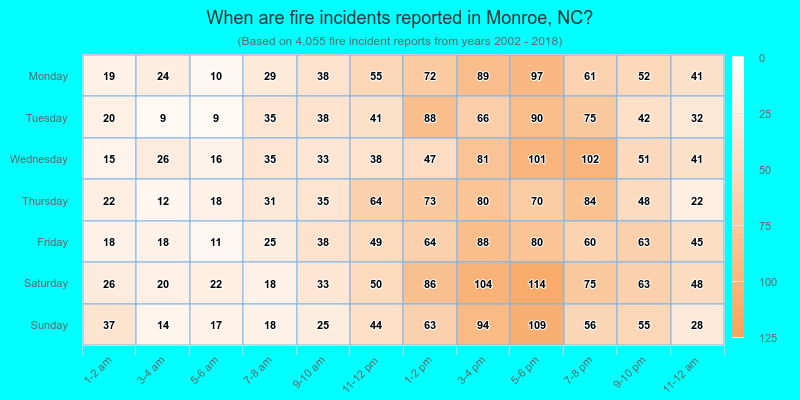
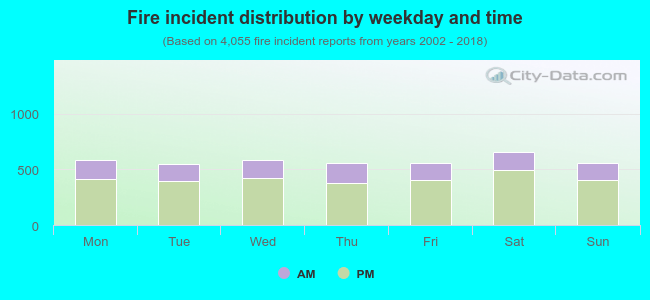 28.5% incidents where reported in the morning and 71.5% in the evening. The most fires (16.3%) took place on Saturday, and the least (13.4%) on Tuesday.
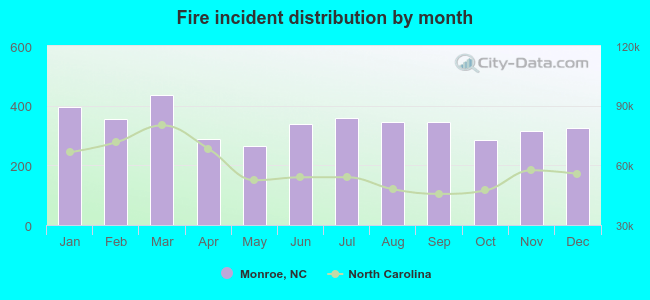 According to the 4,055 fire incidents from years 2002 - 2018 most fires (10.7%) took place during March, and the least (6.5%) in May.
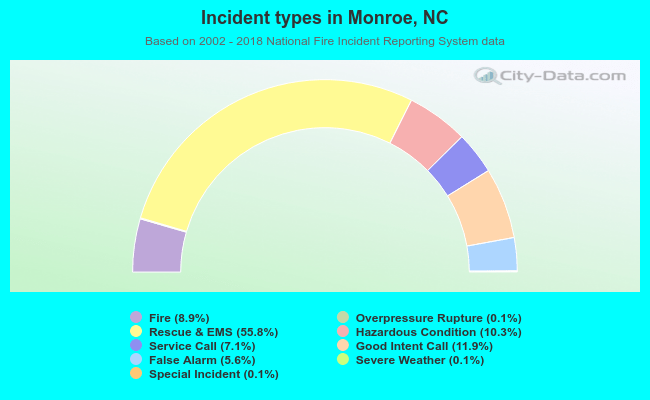 Out of all 45,326 cases reported during the years 2002 - 2018, the most belonged to the categories: Rescue & EMS (55.8%), Good Intent Call (11.9%), and Hazardous Condition (10.3%).
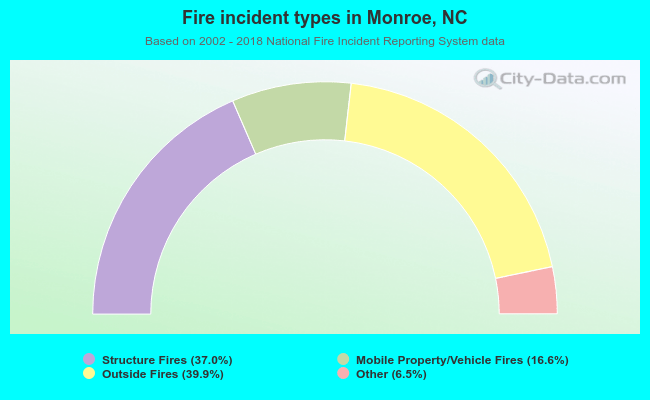 When looking into fire subcategories, the most incidents belonged to: Outside Fires (39.9%), and Structure Fires (37.0%).