Millville: Fire Incidents, New Jersey (NJ)
Where are fire incidents reported in Millville, NJ
Something went wrong! Please refresh the page.
| Fire incidents reported | |
|---|---|
| Sreet name | Count |
| SECOND ST | 464 |
| MAIN ST | 388 |
| HIGH ST | 212 |
| 2ND ST | 192 |
| BROAD ST | 134 |
| THIRD ST | 114 |
| VINE ST | 100 |
| WADE BLVD | 100 |
| MULBERRY ST | 88 |
| WHEATON AVE | 86 |
| CEDAR ST | 74 |
| FOURTH ST | 74 |
| SHARP ST | 74 |
| CARMEL RD | 72 |
| PINE ST | 72 |
| FOUNDRY ST | 68 |
| OAK ST | 68 |
| RIVERSIDE DR | 66 |
| BUCK ST | 62 |
| FIFTH ST | 60 |
| 3RD ST | 52 |
| NEWCOMBTOWN RD | 52 |
| ROUTE 55 | 50 |
| BUCKSHUTEM RD | 46 |
| POWELL ST | 38 |
| DOCK ST | 36 |
| BLUEBIRD LANE | 34 |
| COLUMBIA AVE | 32 |
| DELSEA DR | 32 |
| TENTH ST | 32 |
2004 - 2018 National Fire Incident Reporting System (NFIRS) incidents
- Incident types reported to NFIRS in Millville, NJ
- 2,57530.2%Hazardous Condition
- 2,47729.1%Fire
- 1,39016.3%Rescue & EMS
- 1,26814.9%False Alarm
- 4014.7%Service Call
- 3814.5%Good Intent Call
- 140.2%Special Incident
- 130.2%Overpressure Rupture
- Fire incident types reported to NFIRS in Millville, NJ
- 1,25550.7%Structure Fires
- 85434.5%Outside Fires
- 30112.2%Mobile Property/Vehicle Fires
- 672.7%Other
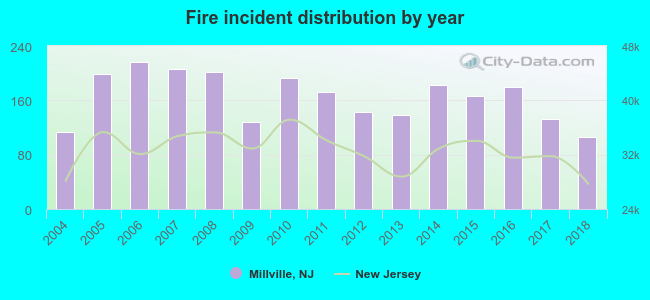 Based on the data from the years 2004 - 2018 the average number of fire incidents per year is 165. The highest number of fires - 216 took place in 2006, and the least - 106 in 2018. The data has a declining trend.
The average number of yearly fire incidents per 10k residents in Millville, NJ compared to nearest cities:
(Note: Based on data for the last 3 years, including only cities with population 5,000 and above)
| Millville: | 48.9 |
| Vineland: | 31.3 |
| Bridgeton: | 51.6 |
| Clayton: | 9.6 |
| Williamstown: | 24.6 |
| Hammonton: | 35.2 |
| Glassboro: | 55.6 |
| Somers Point: | 43.1 |
| Pitman: | 48.3 |
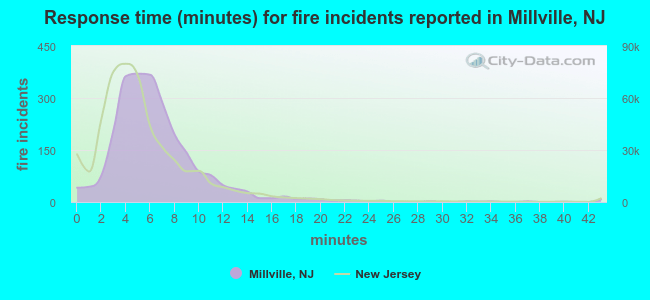 The median response time based on all reported fire incidents is 6 minutes. This is about the same as the New Jersey median value.
The median response time in Millville, NJ compared to nearest cities:
(Note: Based on data for all years, including only cities with at least 500 fire incidents)
| Millville: | 6 minutes |
| Vineland: | 6 minutes |
| Bridgeton: | 5 minutes |
| Mays Landing: | 6 minutes |
| Williamstown: | 8 minutes |
| Hammonton: | 7 minutes |
| Glassboro: | 5 minutes |
| Somers Point: | 6 minutes |
| Cape May Court House: | 5 minutes |
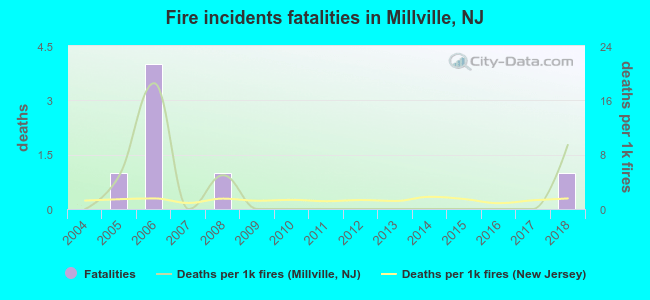 Based on the reports from the years 2004 - 2018 the average number of fire-related yearly deaths is 0. The highest number of reported deaths - 4 took place in 2006, and the lowest - 0 in 2004. The data has an increasing trend.
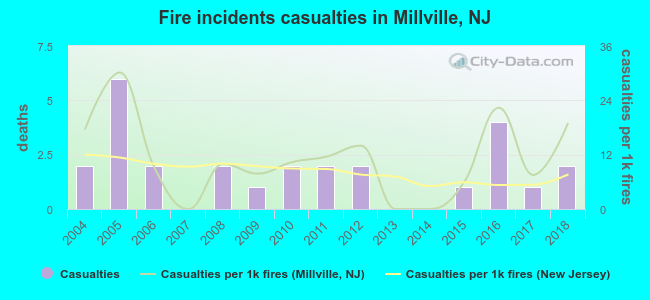 Based on the data from the years 2004 - 2018 the average number of fire-related yearly casualties is 2. The highest number of casualties - 6 took place in 2005, and the lowest - 0 in 2007. The data has a constant trend.
The average number of injuries per 1,000 fires is 11. This indicator was the highest - 30 in 2005, and the lowest 0 in 2007. The trend for casualties per 1,000 incidents is rising. Compared to the New Jersey value the number of injuries per 1,000 incidents is higher.
Based on the data from the years 2004 - 2018 the average number of fire-related yearly casualties is 2. The highest number of casualties - 6 took place in 2005, and the lowest - 0 in 2007. The data has a constant trend.
The average number of injuries per 1,000 fires is 11. This indicator was the highest - 30 in 2005, and the lowest 0 in 2007. The trend for casualties per 1,000 incidents is rising. Compared to the New Jersey value the number of injuries per 1,000 incidents is higher.Casualties per 1,000 incidents in Millville, NJ compared to nearest cities:
(Note: Based on data for all years, including only cities with at least 500 fire incidents)
| Millville: | 10.9 |
| Vineland: | 21.5 |
| Bridgeton: | 14.8 |
| Mays Landing: | 1.8 |
| Williamstown: | 18.2 |
| Hammonton: | 5.4 |
| Glassboro: | 0.8 |
| Somers Point: | 8.7 |
| Cape May Court House: | 11.8 |
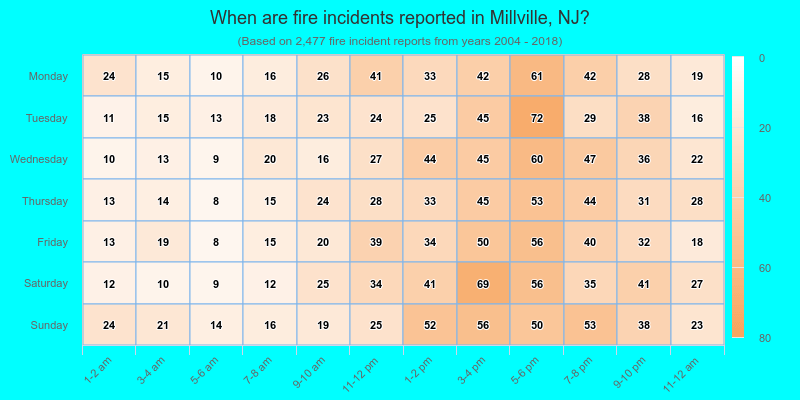
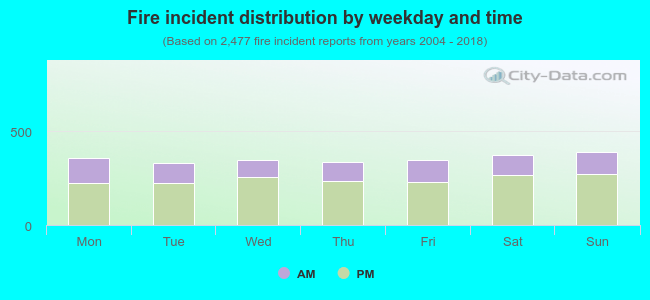 31.0% incidents where reported in the morning and 69.0% in the evening. The most fires (15.8%) took place on Sunday, and the least (13.3%) on Tuesday.
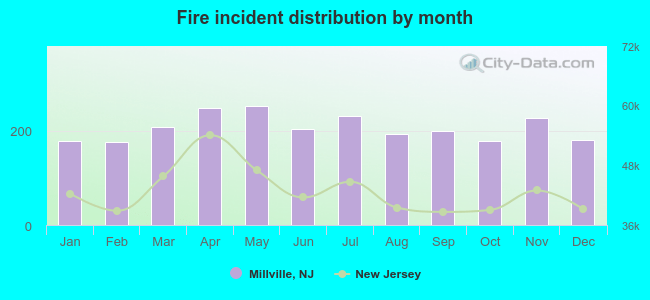 Based on the 2,477 incident reports from years 2004 - 2018 most fires (10.2%) took place during May, and the least (7.1%) in February.
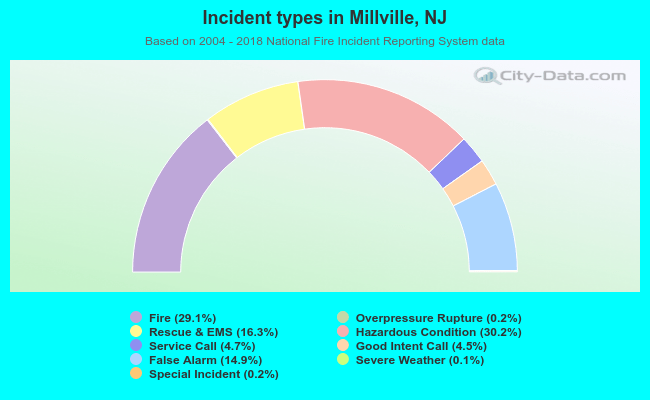 Out of all 8,525 cases reported during the years 2004 - 2018, the most belonged to the categories: Hazardous Condition (30.2%), Fire (29.1%), and Rescue & EMS (16.3%).
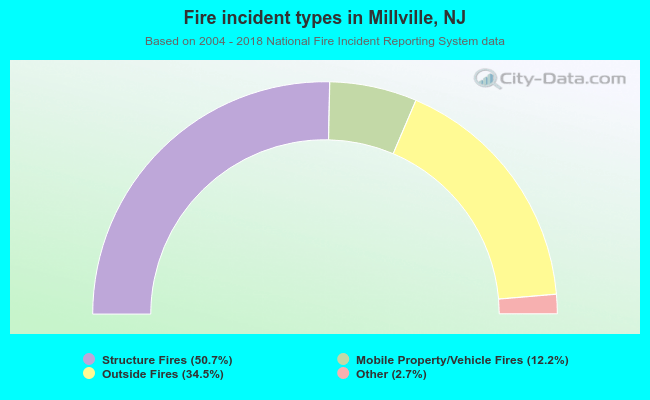 When looking into fire subcategories, the most incidents belonged to: Structure Fires (50.7%), and Outside Fires (34.5%).