Mill Creek: Fire Incidents, Washington (WA)
Where are fire incidents reported in Mill Creek, WA
Something went wrong! Please refresh the page.
|
| |||||||||||||||||||||||||||||||||||||||||||||||||||||||||||||||||||||||||||||||||||||||||||||||||||||||||||||
2002 - 2018 National Fire Incident Reporting System (NFIRS) incidents
- Incident types reported to NFIRS in Mill Creek, WA
- 2,68163.3%Rescue & EMS
- 74717.6%Good Intent Call
- 3027.1%Fire
- 1884.4%False Alarm
- 1784.2%Service Call
- 1283.0%Hazardous Condition
- Fire incident types reported to NFIRS in Mill Creek, WA
- 16354.0%Structure Fires
- 8126.8%Outside Fires
- 3511.6%Mobile Property/Vehicle Fires
- 237.6%Other
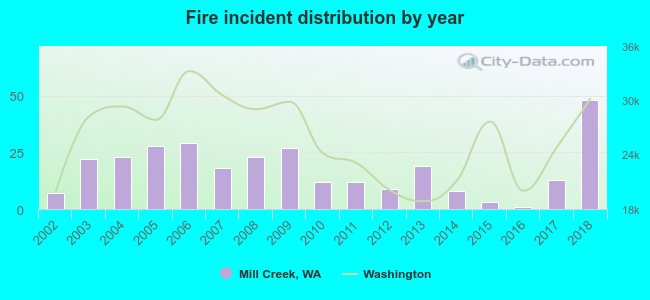 Based on the data from the years 2002 - 2018 the average number of fire incidents per year is 18. The highest number of reported fire incidents - 48 took place in 2018, and the least - 1 in 2016. The data has an increasing trend.
The average number of yearly fire incidents per 10k residents in Mill Creek, WA compared to nearest cities:
(Note: Based on data for the last 3 years, including only cities with population 5,000 and above)
| Mill Creek: | 10.8 |
| Lynnwood: | 56.1 |
| Brier: | 10.4 |
| Mukilteo: | 18.9 |
| Bothell: | 32.5 |
| Snohomish: | 98.1 |
| Mountlake Terrace: | 14.9 |
| Everett: | 40.3 |
| Kenmore: | 14.5 |
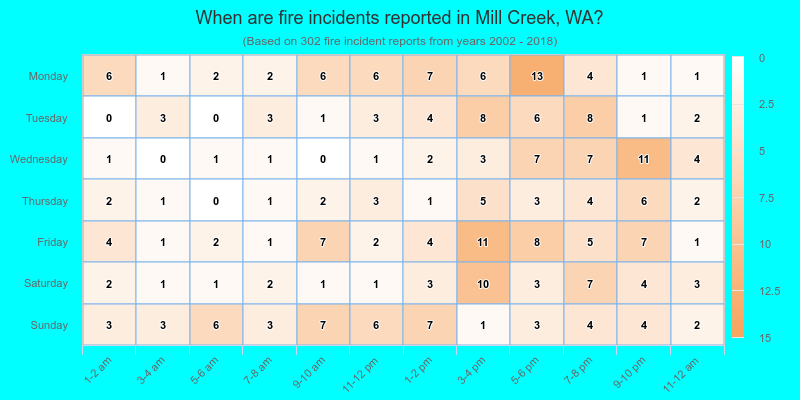
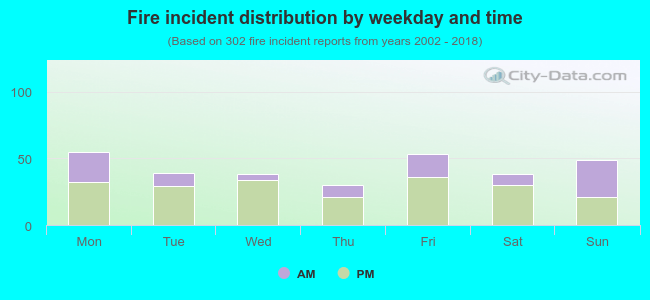 32.8% incidents where reported in the morning and 67.2% in the evening. The most fires (18.2%) took place on Monday, and the least (9.9%) on Thursday.
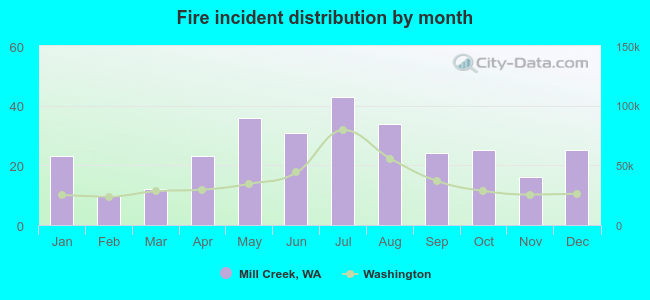 According to the 302 fires from years 2002 - 2018 most fires (14.2%) took place during July, and the least (3.3%) in February.
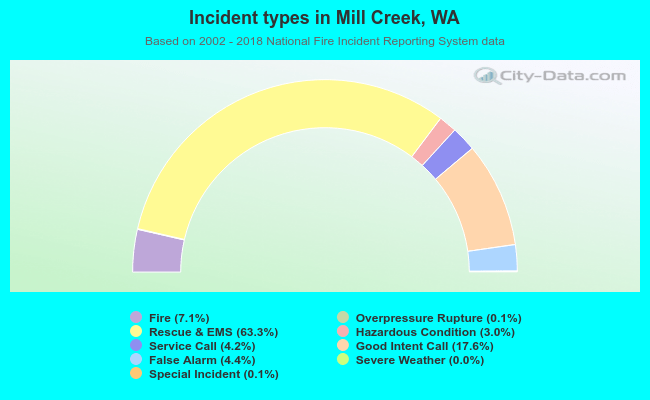 Out of all 4,233 cases reported during the years 2002 - 2018, the most belonged to the categories: Rescue & EMS (63.3%), Good Intent Call (17.6%), and Fire (7.1%).
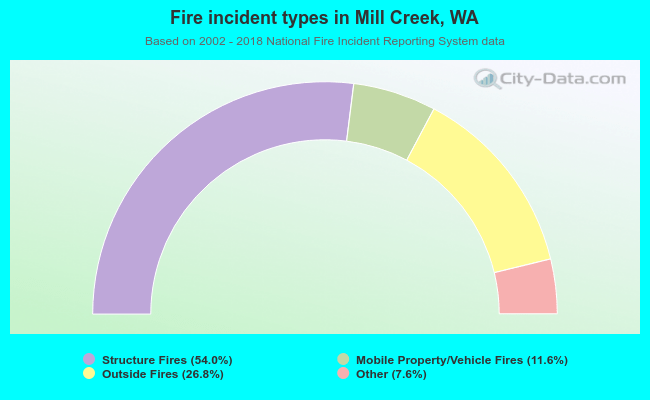 When looking into fire subcategories, the most incidents belonged to: Structure Fires (54.0%), and Outside Fires (26.8%).