Milford: Fire Incidents, Michigan (MI)
Where are fire incidents reported in Milford, MI
Something went wrong! Please refresh the page.
|
| |||||||||||||||||||||||||||||||||||||||||||||||||||||||||||||||||||||||||||||||||||||||||||||||||||||||||||||
2002 - 2018 National Fire Incident Reporting System (NFIRS) incidents
- Incident types reported to NFIRS in Milford, MI
- 3,39459.7%Rescue & EMS
- 77313.6%Service Call
- 5179.1%Hazardous Condition
- 3956.9%Fire
- 3856.8%Good Intent Call
- 2083.7%False Alarm
- 70.1%Special Incident
- Fire incident types reported to NFIRS in Milford, MI
- 19950.4%Structure Fires
- 12030.4%Outside Fires
- 5614.2%Mobile Property/Vehicle Fires
- 205.1%Other
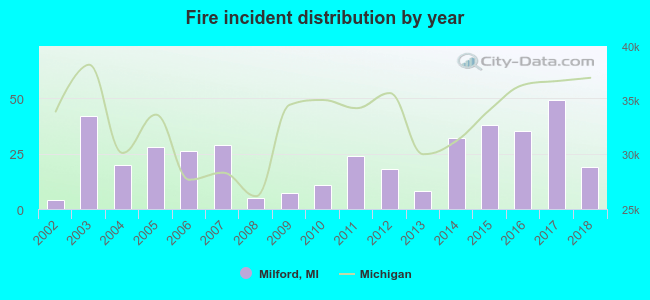 Based on the data from the years 2002 - 2018 the average number of fires per year is 23. The highest number of reported fire incidents - 49 took place in 2017, and the least - 4 in 2002. The data has a rising trend.
The average number of yearly fire incidents per 10k residents in Milford, MI compared to nearest cities:
(Note: Based on data for the last 3 years, including only cities with population 5,000 and above)
| Milford: | 53.1 |
| Wixom: | 23.8 |
| Walled Lake: | 32.3 |
| South Lyon: | 54.9 |
| Novi: | 17.0 |
| Brighton: | 156.3 |
| Northville: | 96.4 |
| Waterford: | 12.0 |
| Farmington Hills: | 15.0 |

 32.7% incidents where reported in the morning and 67.3% in the evening. The most fires (19.5%) took place on Friday, and the least (9.1%) on Thursday.
 According to the 395 reports from years 2002 - 2018 most fires (13.9%) took place during March, and the least (3.8%) in October.
 Out of all 5,687 cases reported during the years 2002 - 2018, the most belonged to the categories: Rescue & EMS (59.7%), Service Call (13.6%), and Hazardous Condition (9.1%).
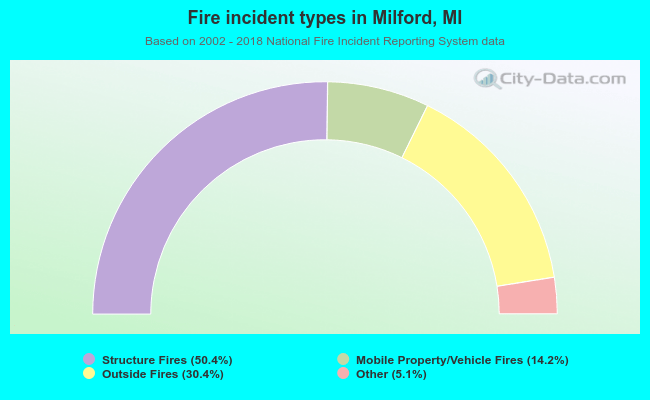 When looking into fire subcategories, the most reports belonged to: Structure Fires (50.4%), and Outside Fires (30.4%).