Medina: Fire Incidents, Ohio (OH)
Where are fire incidents reported in Medina, OH
Something went wrong! Please refresh the page.
| Fire incidents reported | |
|---|---|
| Sreet name | Count |
| MEDINA RD | 234 |
| COURT ST | 164 |
| LAKE RD | 144 |
| LAFAYETTE RD | 138 |
| SMITH RD | 116 |
| RIDGE RD | 108 |
| GRANGER RD | 90 |
| PEARL RD | 84 |
| STATE RD | 80 |
| WASHINGTON ST | 70 |
| UNION ST | 64 |
| I-71 | 60 |
| RYAN RD | 58 |
| REMSEN RD | 54 |
| LIBERTY ST | 50 |
| ABBEYVILLE RD | 48 |
| WADSWORTH RD | 48 |
| WEYMOUTH RD | 46 |
| ERHART RD | 44 |
| FENN RD | 42 |
| BEAR SWAMP RD | 38 |
| REAGAN PKY | 38 |
| RIVER STYX RD | 38 |
| SHARON COPLEY RD | 38 |
| SPENCER LAKE RD | 38 |
| BEACH RD | 36 |
| COLUMBIA RD | 36 |
| POE RD | 36 |
| WEDGEWOOD RD | 36 |
| BIRCH HILL DR | 34 |
| Other | 514 |
2002 - 2018 National Fire Incident Reporting System (NFIRS) incidents
- Incident types reported to NFIRS in Medina, OH
- 5,23635.0%Rescue & EMS
- 2,62417.5%Fire
- 2,48516.6%Hazardous Condition
- 1,62710.9%False Alarm
- 1,4319.6%Service Call
- 1,2848.6%Good Intent Call
- 1981.3%Special Incident
- 470.3%Overpressure Rupture
- 360.2%Severe Weather
- Fire incident types reported to NFIRS in Medina, OH
- 1,23847.2%Structure Fires
- 87133.2%Outside Fires
- 47218.0%Mobile Property/Vehicle Fires
- 431.6%Other
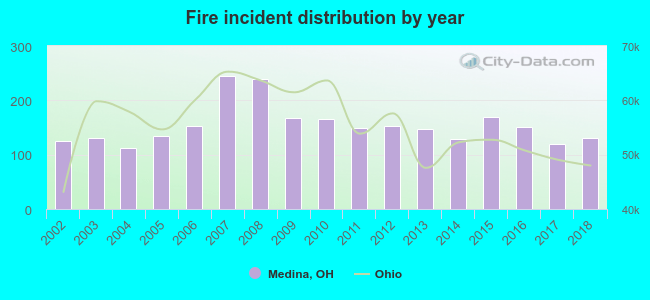 According to the data from the years 2002 - 2018 the average number of fires per year is 154. The highest number of reported fire incidents - 244 took place in 2007, and the least - 113 in 2004. The data has an increasing trend.
The average number of yearly fire incidents per 10k residents in Medina, OH compared to nearest cities:
(Note: Based on data for the last 3 years, including only cities with population 5,000 and above)
| Medina: | 50.5 |
| Brunswick: | 37.2 |
| Wadsworth: | 30.6 |
| Rittman: | 43.2 |
| Strongsville: | 22.2 |
| Fairlawn: | 48.5 |
| Norton: | 30.4 |
| Grafton: | 85.6 |
| North Royalton: | 19.5 |
 The median response time based on all reported fire incidents is 10 minutes. This is higher than the Ohio median value.
The median response time in Medina, OH compared to nearest cities:
(Note: Based on data for all years, including only cities with at least 500 fire incidents)
| Medina: | 10 minutes |
| Brunswick: | 6 minutes |
| Wadsworth: | 6 minutes |
| Strongsville: | 6 minutes |
| Fairlawn: | 4 minutes |
| Norton: | 7 minutes |
| Grafton: | 10 minutes |
| Richfield: | 7 minutes |
| North Royalton: | 5 minutes |
 Based on the data from the years 2002 - 2018 the average number of fire-related fatalities per year is 0. The highest number of deaths - 2 took place in 2008, and the lowest - 0 in 2002. The data has a constant trend.
The average number of fatalities per 1,000 fires is 2. This indicator was the highest - 8 in 2008, and the lowest 0 in 2002. The trend for fatalities per 1,000 fires is constant. Compared to the state value the number of deaths per 1,000 fires is about the same.
Based on the data from the years 2002 - 2018 the average number of fire-related fatalities per year is 0. The highest number of deaths - 2 took place in 2008, and the lowest - 0 in 2002. The data has a constant trend.
The average number of fatalities per 1,000 fires is 2. This indicator was the highest - 8 in 2008, and the lowest 0 in 2002. The trend for fatalities per 1,000 fires is constant. Compared to the state value the number of deaths per 1,000 fires is about the same.Deaths per 1,000 incidents in Medina, OH compared to nearest cities:
(Note: Based on data for all years, including only cities with at least 2,500 fire incidents)
| Medina: | 2.3 |
| Akron: | 2.8 |
| Parma: | 0.7 |
| Cuyahoga Falls: | 2.7 |
| Elyria: | 3.5 |
 Based on the data from the years 2002 - 2018 the average number of fire-related casualties per year is 3. The highest number of casualties - 7 took place in 2016, and the lowest - 0 in 2013. The data has a dropping trend.
The average number of casualties per 1,000 fires is 23. This indicator was the highest - 46 in 2016, and the lowest 0 in 2013. The trend for injuries per 1,000 incidents is dropping. Compared to the Ohio value the number of casualties per 1,000 fire incidents is higher.
Based on the data from the years 2002 - 2018 the average number of fire-related casualties per year is 3. The highest number of casualties - 7 took place in 2016, and the lowest - 0 in 2013. The data has a dropping trend.
The average number of casualties per 1,000 fires is 23. This indicator was the highest - 46 in 2016, and the lowest 0 in 2013. The trend for injuries per 1,000 incidents is dropping. Compared to the Ohio value the number of casualties per 1,000 fire incidents is higher.Casualties per 1,000 incidents in Medina, OH compared to nearest cities:
(Note: Based on data for all years, including only cities with at least 500 fire incidents)
| Medina: | 22.5 |
| Brunswick: | 12.6 |
| Wadsworth: | 17.4 |
| Strongsville: | 9.1 |
| Fairlawn: | 11.0 |
| Norton: | 10.3 |
| Grafton: | 1.2 |
| Richfield: | 2.8 |
| North Royalton: | 11.0 |
 32.7% incidents where reported in the morning and 67.3% in the evening. The most fires (17.1%) took place on Monday, and the least (12.8%) on Thursday.
 According to the 2,624 incident reports from years 2002 - 2018 most fires (10.3%) took place during May, and the least (6.2%) in January.
 Out of all 14,968 cases reported during the years 2002 - 2018, the most belonged to the categories: Rescue & EMS (35.0%), Fire (17.5%), and Hazardous Condition (16.6%).
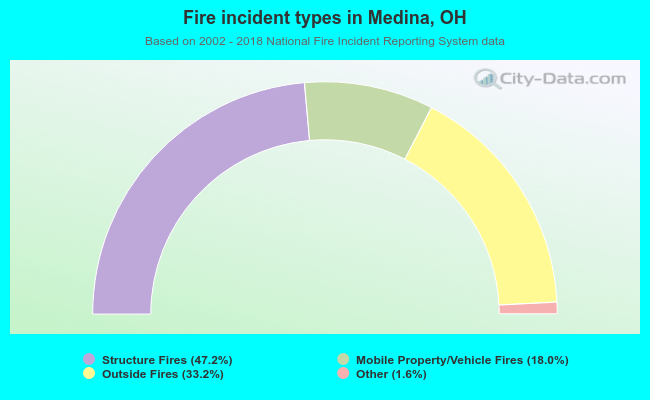 When looking into fire subcategories, the most incidents belonged to: Structure Fires (47.2%), and Outside Fires (33.2%).