Mauldin: Fire Incidents, South Carolina (SC)
Where are fire incidents reported in Mauldin, SC
Something went wrong! Please refresh the page.
| Fire incidents reported | |
|---|---|
| Sreet name | Count |
| BUTLER RD | 138 |
| WOODRUFF RD | 106 |
| MILLER RD | 86 |
| I-385 | 76 |
| I385 | 74 |
| MAIN ST | 60 |
| N MAIN ST | 56 |
| W BUTLER RD | 54 |
| E BUTLER RD | 48 |
| ASHMORE BRIDGE RD | 32 |
| BRIDGES RD | 30 |
| OLD MILL RD | 28 |
| BETHEL RD | 24 |
| RIDGE RD | 24 |
| S MAIN ST | 24 |
| BROOKS RD | 22 |
| E BUTLER | 20 |
| TANNER RD | 20 |
| DANIEL CT | 18 |
| HOLLAND RD | 18 |
| HWY 276 | 18 |
| LOG SHOALS RD | 18 |
| FORRESTER DR | 16 |
| ADAMS MILL RD | 14 |
| LANEWOOD DR | 14 |
| VALLEY GRN | 14 |
| WOODRIDGE CIR | 14 |
| BALCOMBE BLVD | 12 |
| BASSWOOD DR | 12 |
| GREENBRIAR DR | 12 |
| Other | 31 |
2002 - 2018 National Fire Incident Reporting System (NFIRS) incidents
- Incident types reported to NFIRS in Mauldin, SC
- 7,69360.5%Rescue & EMS
- 1,2289.7%False Alarm
- 1,1509.0%Service Call
- 1,1338.9%Fire
- 9547.5%Hazardous Condition
- 4493.5%Good Intent Call
- 410.3%Severe Weather
- 380.3%Special Incident
- 290.2%Overpressure Rupture
- Fire incident types reported to NFIRS in Mauldin, SC
- 45039.7%Outside Fires
- 29826.3%Structure Fires
- 22419.8%Mobile Property/Vehicle Fires
- 16114.2%Other
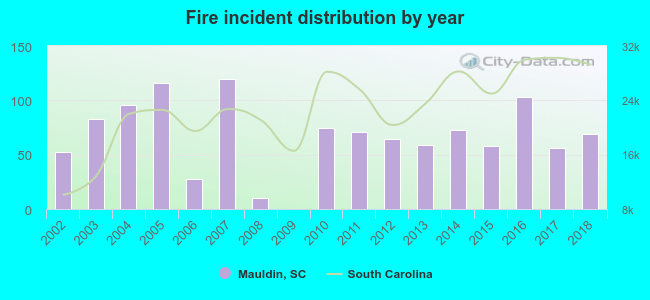 According to the data from the years 2002 - 2018 the average number of fire incidents per year is 67. The highest number of reported fires - 120 took place in 2007, and the least - 0 in 2009. The data has a growing trend.
The average number of yearly fire incidents per 10k residents in Mauldin, SC compared to nearest cities:
(Note: Based on data for the last 3 years, including only cities with population 5,000 and above)
| Mauldin: | 30.6 |
| Simpsonville: | 61.9 |
| Gantt: | 0.7 |
| Greenville: | 183.0 |
| Fountain Inn: | 150.0 |
| Taylors: | 61.7 |
| Piedmont: | 313.5 |
| Powderville: | 49.0 |
| Greer: | 107.6 |
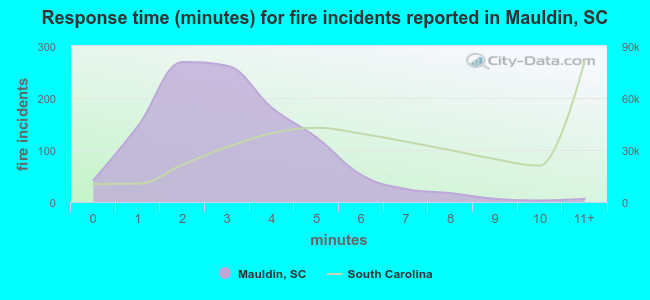 The median response time based on all reported fire incidents is 3 minutes. This is much lower than the South Carolina median value.
The median response time in Mauldin, SC compared to nearest cities:
(Note: Based on data for all years, including only cities with at least 500 fire incidents)
| Mauldin: | 3 minutes |
| Simpsonville: | 4 minutes |
| Greenville: | 4 minutes |
| Fountain Inn: | 7 minutes |
| Taylors: | 5 minutes |
| Piedmont: | 6 minutes |
| Greer: | 5 minutes |
| Pelzer: | 6 minutes |
| Duncan: | 6 minutes |
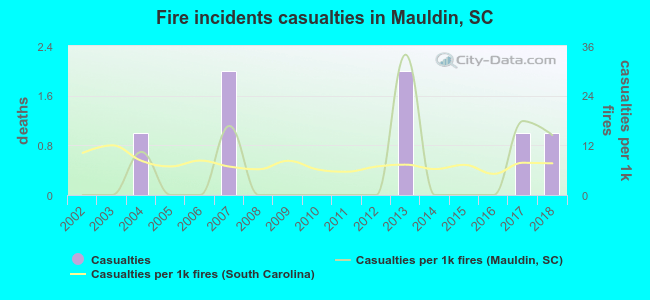 Based on the reports from the years 2002 - 2018 the average number of fire-related casualties per year is 0. The highest number of casualties - 2 took place in 2007, and the lowest - 0 in 2002. The data has an increasing trend.
The average number of casualties per 1,000 fires is 5. This indicator was the highest - 34 in 2013, and the lowest 0 in 2002. The trend for casualties per 1,000 incidents is increasing. Compared to the South Carolina value the number of injuries per 1,000 fire incidents is similar.
Based on the reports from the years 2002 - 2018 the average number of fire-related casualties per year is 0. The highest number of casualties - 2 took place in 2007, and the lowest - 0 in 2002. The data has an increasing trend.
The average number of casualties per 1,000 fires is 5. This indicator was the highest - 34 in 2013, and the lowest 0 in 2002. The trend for casualties per 1,000 incidents is increasing. Compared to the South Carolina value the number of injuries per 1,000 fire incidents is similar.Casualties per 1,000 incidents in Mauldin, SC compared to nearest cities:
(Note: Based on data for all years, including only cities with at least 500 fire incidents)
| Mauldin: | 6.2 |
| Simpsonville: | 5.3 |
| Greenville: | 7.3 |
| Fountain Inn: | 4.5 |
| Taylors: | 6.0 |
| Piedmont: | 3.8 |
| Greer: | 5.2 |
| Pelzer: | 1.4 |
| Duncan: | 4.2 |
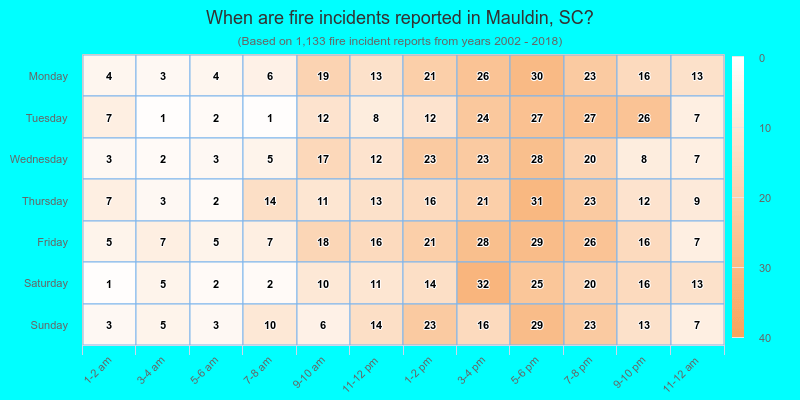
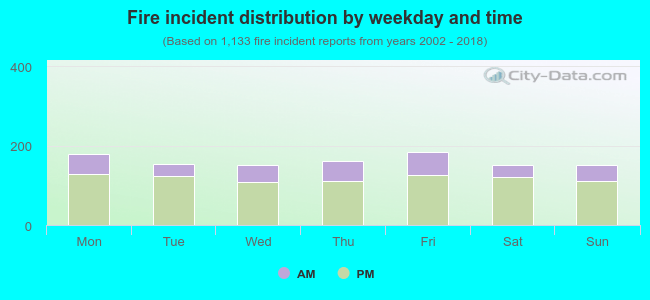 26.7% incidents where reported in the morning and 73.3% in the evening. The most fires (16.3%) took place on Friday, and the least (13.3%) on Wednesday.
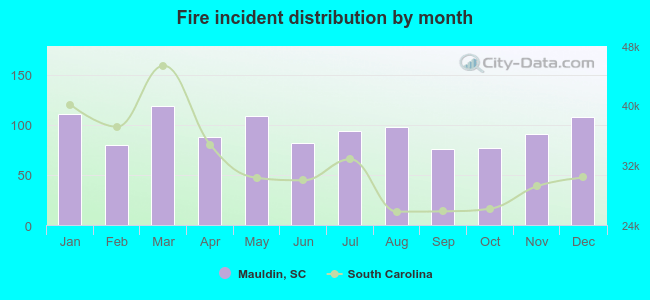 Based on the 1,133 fire incident reports from years 2002 - 2018 most fires (10.5%) took place during March, and the least (6.7%) in September.
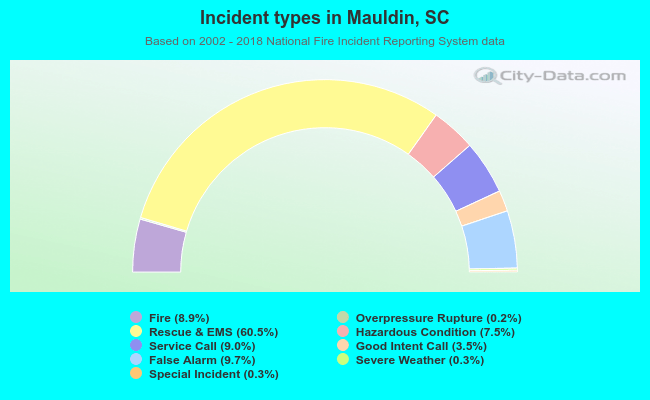 Out of all 12,715 cases reported during the years 2002 - 2018, the most belonged to the categories: Rescue & EMS (60.5%), False Alarm (9.7%), and Service Call (9.0%).
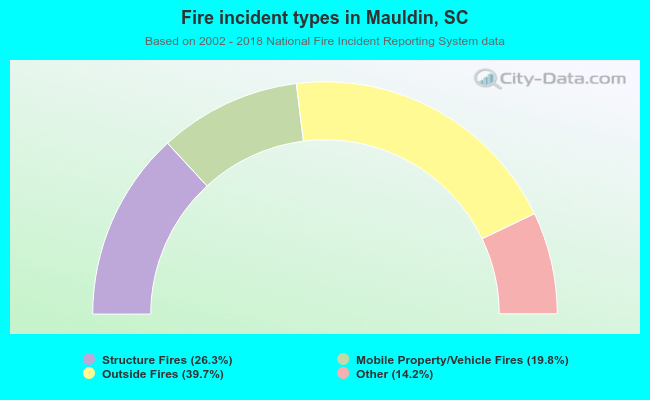 When looking into fire subcategories, the most incidents belonged to: Outside Fires (39.7%), and Structure Fires (26.3%).